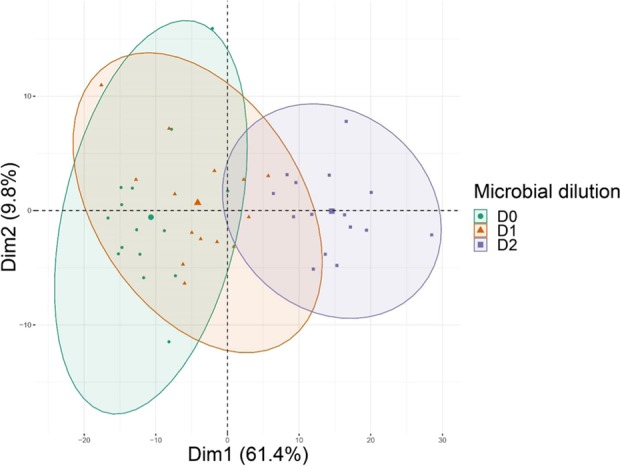
Figure 5.

Effect of the different microbial dilutions on VOCs emissions by soil. The m/z of the 20 compounds that are explaining the variance in the two first components are shown on the graph. The percentage of the variance explained by the 2 first components is shown on each axis. The ellipses represent the similarity between samples. Samples in the same ellipsis are more similar than samples displayed in two different ellipses. D0: no dilution equal of the microbial diversity. D1: microbial diversity dilution equal to 10−3. D2: microbial diversity dilution equal to 10−5.
