Figure 6.

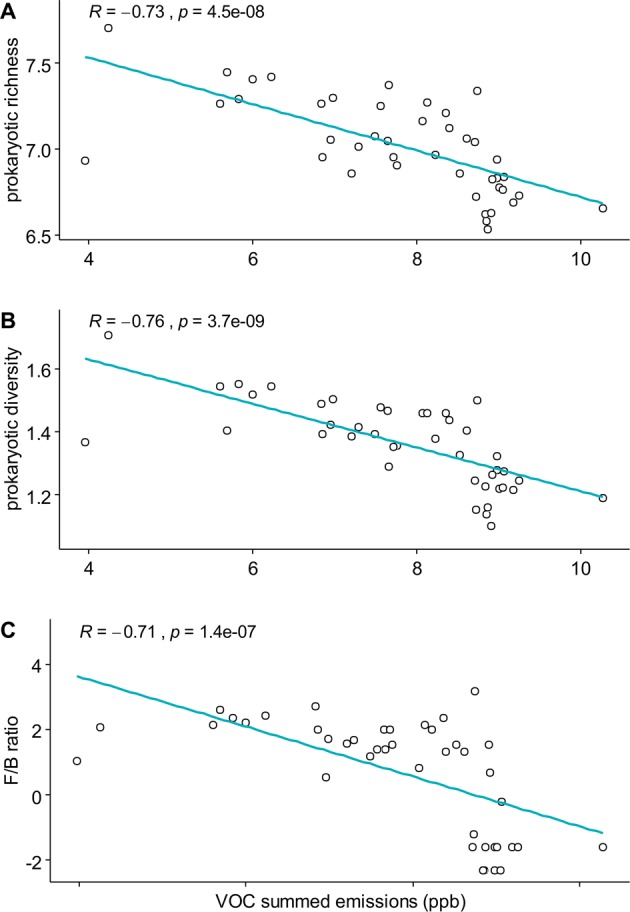
Correlation between log (VOC summed emissions) and (a) log (prokaryotic richness), (b) log (prokaryotic diversity), (c) log (F/P ratio). The Spearman correlation coefficient (R) and the p.value (p) are also displayed for all correlations.

Correlation between log (VOC summed emissions) and (a) log (prokaryotic richness), (b) log (prokaryotic diversity), (c) log (F/P ratio). The Spearman correlation coefficient (R) and the p.value (p) are also displayed for all correlations.