
Figure 4.
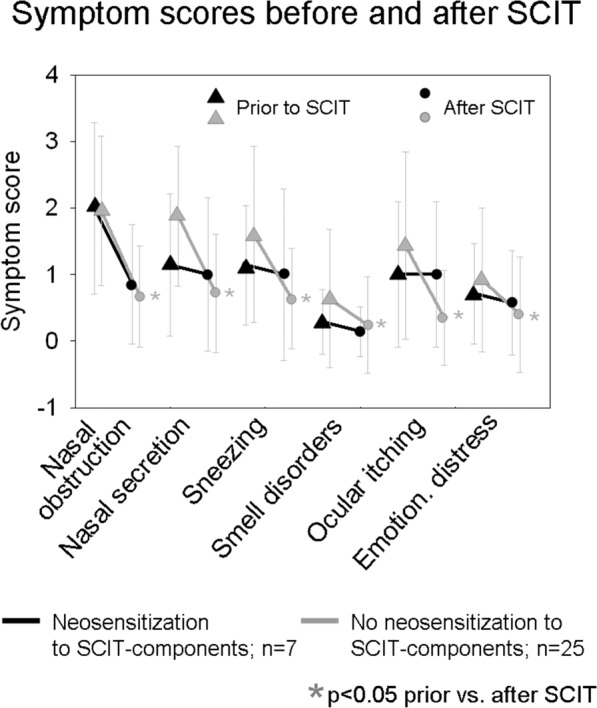
Change of symptom scores in the course of SCIT. The graphs show the symptom scores before and after SCIT - in SCIT-treated patients without neosensitization to treatment-related components (grey graphs; n = 25) and in SCIT-treated patients with de novo sensitization to therapy-related components (black graphs, n = 7). Only in SCIT-treated patients without neosensitization to treatment-related components, a significant reduction of symptom severity is observed after SCIT (*p < 0.05).