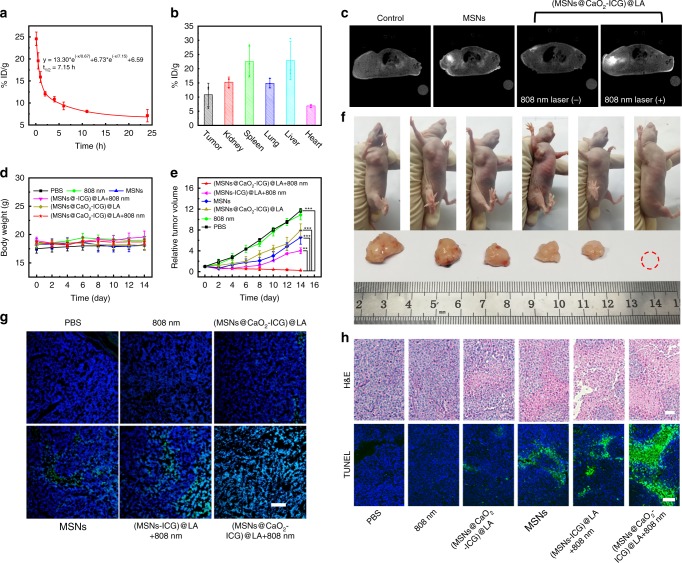
Fig. 5. In vivo demonstration of synergistic CDT/PDT.
a Blood circulation and b biodistribution of (MSNs@CaO2-ICG)@LA by measuring Mn concentrations over a span of 24 h after intravenous injection. Data are presented as mean ± SD (n = 3). c In vivo MRI of MCF-7 tumor-bearing mice with different treatments after 24 h (Laser: 808 nm, 0.64 W cm−2, 10 min). d The body weight and e the relative cancer volume changes of MCF-7 tumor-bearing mice after various treatments in 14 days. The mean value was calculated by the two-tailed t test (mean ± SD, n = 5). **P < 0.01 and ***P < 0.001, compared with the indicated group. f Representative photos of the mice with different treatments and corresponding tumor tissues collected from different groups at 14 days. g DCFH (green)- and DAPI (blue)-costained tumor tissues collected from different groups at 24 h post injection. Scale bar: 200 μm. h H&E- or TUNEL-stained tumor slices collected from different groups at 14 days. Scale bar: 100 μm.

