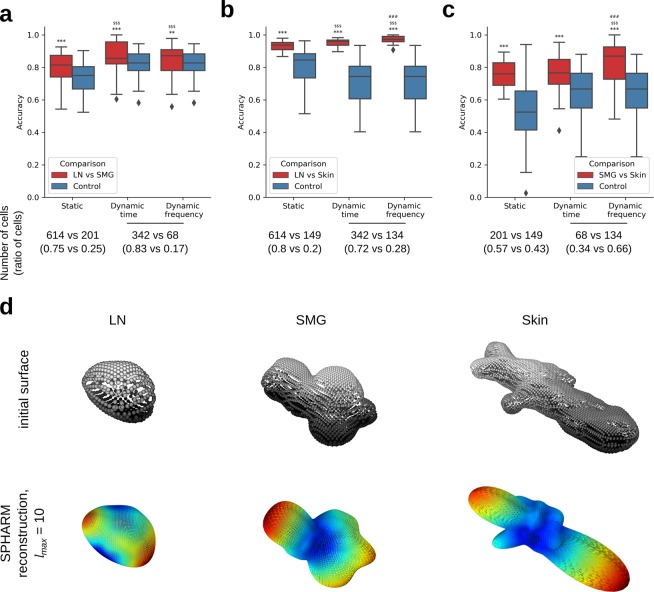
Figure 7.
Classification of T cells for various pairs of classes relative to control. (a) LN vs SMG. (b) LN vs Skin. (c) SMG vs Skin. (d) Surfaces and SPHARM reconstructions of representative cells from the three analyzed classes. Significantly higher than control: **p < 0.01, ***p < 0.001; significantly higher than static features: $$$p < 0.001; significantly higher than dynamic time features: ###p < 0.001; one-sided Mann-Whitney test, n = 150 per group. Numbers below the box plots indicate the number (ratio) of cells in each class for the corresponding class pair. For ratios between 0.4 and 0.6, the random classifier was used as control. In all other cases, the majority classifier was used, whose accuracy is defined by the ratio of cells. In the dynamic classifiers, fewer cells were analyzed because not all cell tracks were sufficiently long (20 time points) to be included. This resulted in different ratios between cell numbers and hence different control accuracies for the static and dynamic classifiers.

