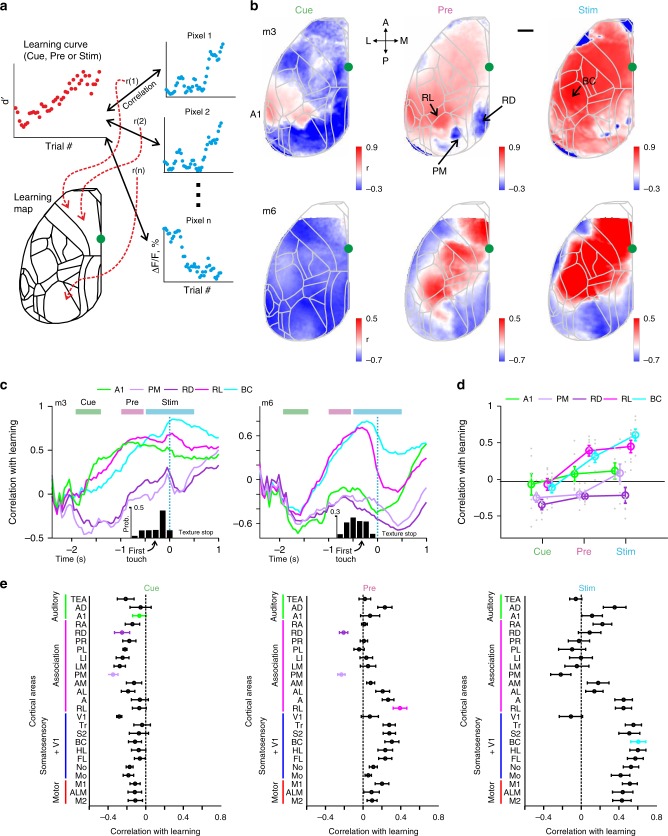
Fig. 5. Learning maps reveal dissociation of association areas in relationship to learning.
a Schematic illustration for calculating a learning map. Each pixel in the maps reflects the correlation coefficient (r) between the mouse’s learning curve and the curve of learning-related ΔF/F change of the respective pixel. The latter can be averaged across the key trial periods (i.e. cue, pre, or stim) or calculated for each time frame. b Learning maps during cue-, pre-, and stim-periods in two example mice. Color denotes r-values. Scale bar is 1 mm. c Correlation with learning as a function of time for the 5 key areas in two example mice. Histograms at the bottom indicate distribution of the first touch. d Correlation with learning during cue-, pre-, and stim-periods for the 5 areas. Error bars are s.e.m. across mice. Gray dots depict individual mice. e Correlation with learning during cue-, pre-, and stim-periods for all areas. Error bars are s.e.m. across mice.

