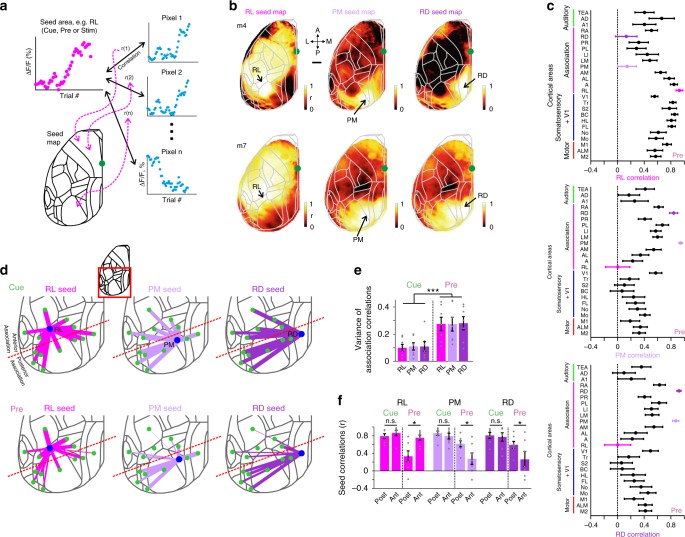
Fig. 6. Functional reorganization of association cortex during learning.
a Schematic of calculating a seed correlation map. Each pixel in the map reflects the correlation coefficient (r) between the learning-related ΔF/F curve of a seed area (e.g. RL, PM, or RD) and the learning-related ΔF/F signal changes of the respective pixel. Seed maps can be calculated separately for cue-, pre-, or stim-period. b Seed maps for RL, PM, and RD during pre-period in two example mice. Color denotes r-values. Scale bar is 1 mm. c Correlation between the three seed areas and all the other areas during pre-period, averaged across all mice. Error bars are s.e.m. across mice. d 2D overview of the inter-areal correlations across learning during cue- (top) and pre-period (bottom) between RL (left), PM (middle), and RD (right) and the surrounding cortical areas (also including A1, BC, and V1). Line width is proportional to the average r-value across all mice. Red dashed line indicates separation into anterior and posterior association areas. e Variance of inter-areal correlations within all association areas for each seed area in cue- and pre-period. Error bars are s.e.m. across mice. Gray dots depict individual mice. f Seed area correlation values for the three areas during cue- and pre-period, averaged separately for anterior or posterior association areas. Error bars are s.e.m. across mice. Gray dots depict individual mice. *P < 0.05. ***P < 0.001. n.s. not significant. Wilcoxon signed-rank test.

