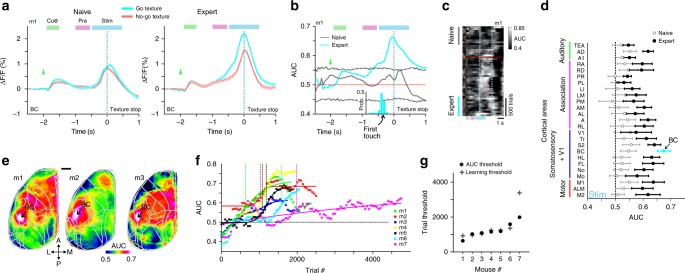
Fig. 7. Emergence of discrimination power in barrel cortex during learning.
a BC activity in an example mouse for go (cyan) and no-go (red) trials in naïve (left) and expert (right) mouse. Error bars are s.e.m. across trials. b ROC-AUC values for go vs. no-go trials as a function of time for naïve (gray) and expert (cyan) mice. Dashed gray lines indicate mean ± 2 s.d. of shuffled data. Same example as in a. Histogram below depicts the distribution of the first touch for the expert case in this example. c Heat map of trial-related AUC values across learning dimension (vertical axis) in the same example mouse. Dashed red line indicates learning threshold. Dashed cyan lines indicate texture-in period. d Pooled AUC values during stim-period in all areas for expert (blue) and naïve (black) mice. Error bars are s.e.m. across mice. e AUC maps during stim-period in three example expert mice. Color denotes AUC values. Scale bar is 1 mm. f AUC values in BC during stim-period across learning for all mice. Threshold for each mouse is indicated with a vertical line at the inflection point of the sigmoid fit. g Inflection points of AUC curves defining ‘AUC thresholds’. Learning thresholds are marked with gray plus signs.

