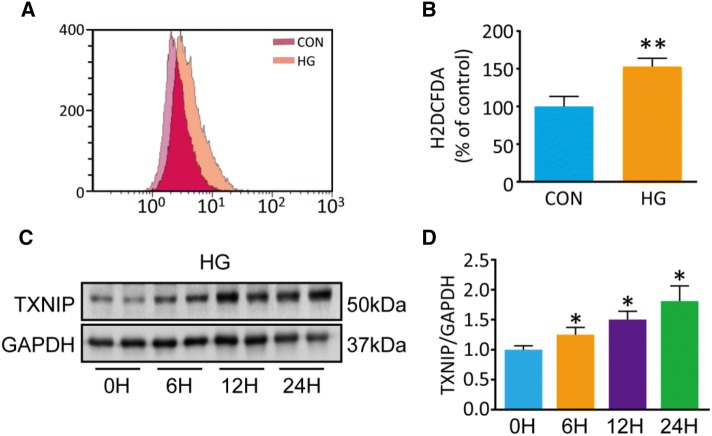
Fig. 4.
Intracellular ROS and TXNIP are notably increased in PC12 cells after 50 mmol/L HG treatment compared with controls (5 mmol/L glucose). A Flow cytometry for intracellular ROS stained by H2DCDFA. B Quantification of ROS (**P < 0.01 vs controls; n = 3). C, D Western blots and analysis for TXNIP (*P < 0.05 vs 0 h group; n = 3).

