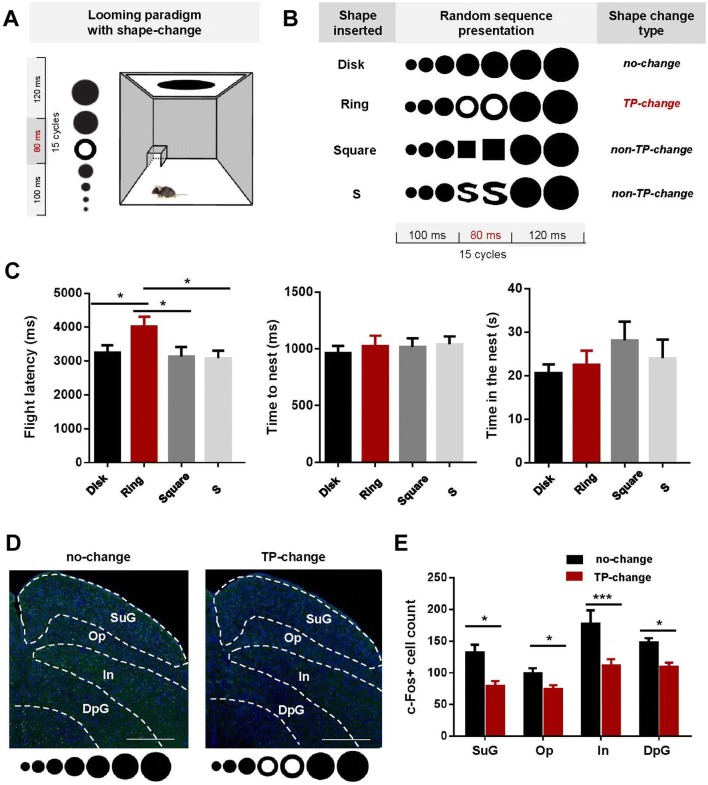
Fig. 1.
Topological changes increase flight latency and decrease neuron activation in the SC of mice. A Schematic of the looming testing environment. B The four visual stimuli. C Flight latency, time to nest, and time in nest in response to the four stimuli (80 mice). D, E Representative immunohistochemistry and quantification showing less c-fos immunoreactivity after TP-change looming stimuli (12 sections) than normal looming stimuli (18 sections) in all layers of the SC (scale bars in (D), 500 μm). Graphs show the mean ± SEM; *P < 0.05, ***P < 0.001, Student’s t-test with Holm-Sidak’s correction.

