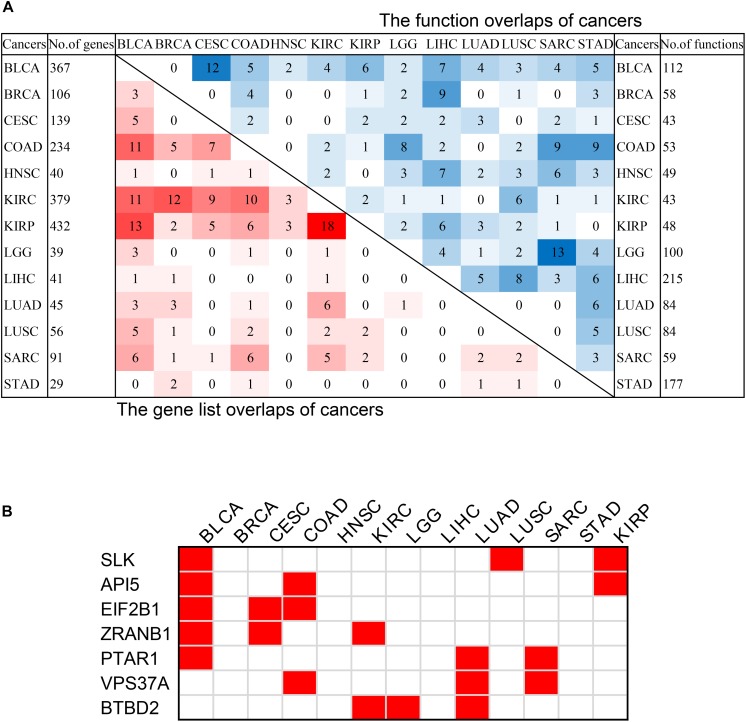
FIGURE 6.
The intersection of pan-cancer genes. (A) The intersections of the lists of survival-related genes (left bottom) and the intersection of associated functions (top right corner) of cancers. The total numbers of genes associated with survival of each cancer were on the left, and the total associated functions were on the right. The color blocks represented the number of intersecting samples of each two cancers. The darker the color, the greater the intersection was. (B) The pan-cancer survival-related genes. The red blocks indicated that the gene was survival-associated with the cancer.

