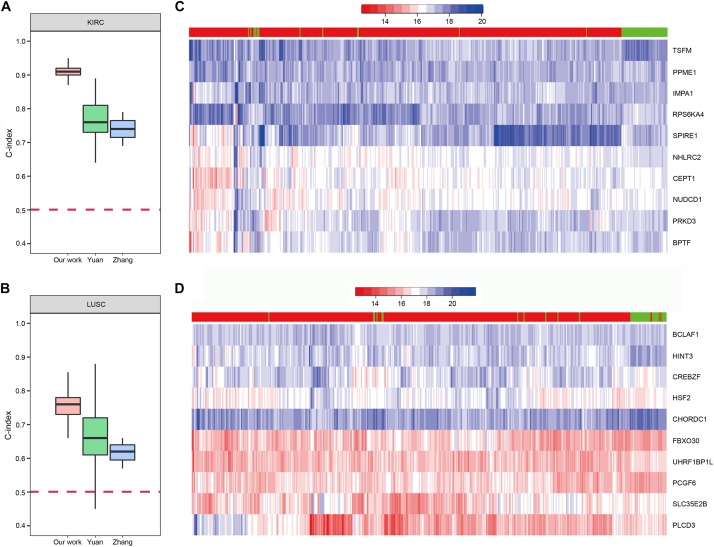
FIGURE 9.
The prognostic biomarkers of KIRC and LUSC. (A,B) The C-index comparison of the prognostic power of our 10-gene prognostic biomarkers and other work. (C,D) The heatmap of samples hierarchical clustering by the expression of the 10-gene prognostic biomarkers. The bar on the top of the heatmap indicated the group the samples really belong to. Red represented tumor and green represented normal.

