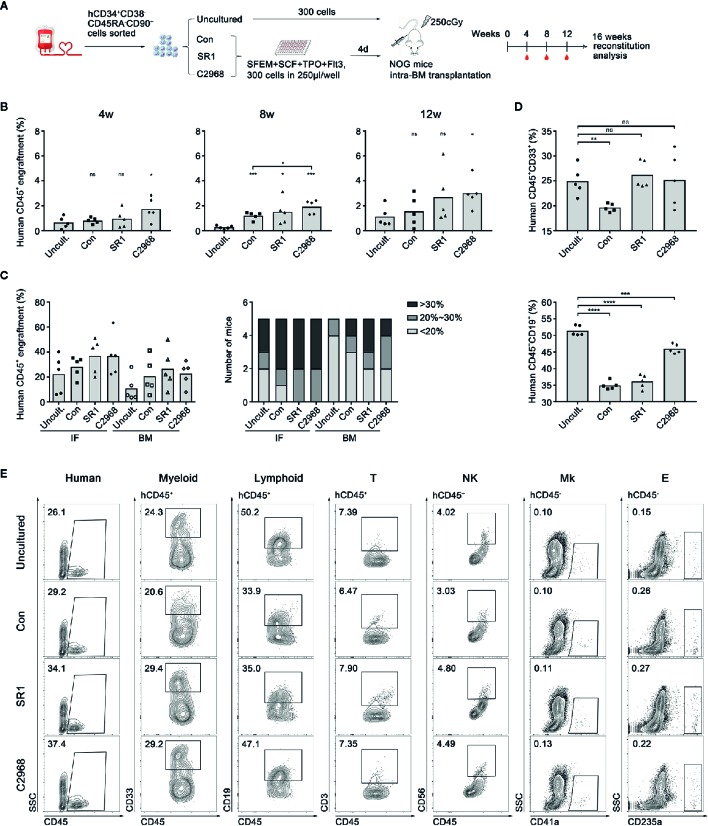
Figure 3.
Analysis of the effect of chrysin treatment on human hematopoietic cell engraftment and reconstitution in NOG mice. (A) Transplantation strategy with uncultured or ex vivo expanded human CD34+CD38−CD45RA−CD90+ cells. Uncultured cells were transplanted into NOG mice on day 0 and cultured cells derived from 300 input cells were transplanted in to NOG mice on day 4. (B) Levels of human cell engraftment in peripheral blood (PB) of NOG mice at 4, 8, or 12 weeks post-transplantation. (n = 5 mice per group) (C) Levels of the engrafting human cells (hCD45+) in the injection side bone marrow (IF) and the opposite side bone marrow (BM) at 16 weeks post-transplantation. Number of mice at different engraftment levels (< 20%; 20%~30%; > 30%) in each group were shown. (D) Levels of the reconstituting myeloid (hCD45+ CD33+) and lymphoid (hCD45+ CD19+) in the injection side and the opposite side bone marrow at 16 weeks post-transplantation. (E) Representative flow cytometric profiles of the engrafting human CD45+ cell and myeloid, lymphoid, T lymphocyte (hCD45+ CD3+), natural killer cell (NK, hCD45+ CD56+), megakaryocyte (Mk, hCD45− CD41a+), and erythroid (E, hCD45− CD235a+) reconstitution in BM 16 weeks post-transplantation. All data represent the means ± SD. Compared with uncultured group unless specified, *p < 0.05, ***p < 0.001, ****p < 0.0001 and ns, no significance by two-tailed unpaired t-test.●, ■, ▲ and ♦ represent a single data point in Uncultured (Uncult.), Con, SR1 and C2968 groups respectively in (B, D). ●, ■, ▲ and ♦ represent a single data point of IF in Uncult., Con, SR1 and C2968 groups respectively while ○, □, Δ and ◊ represent those of BM in (C).

