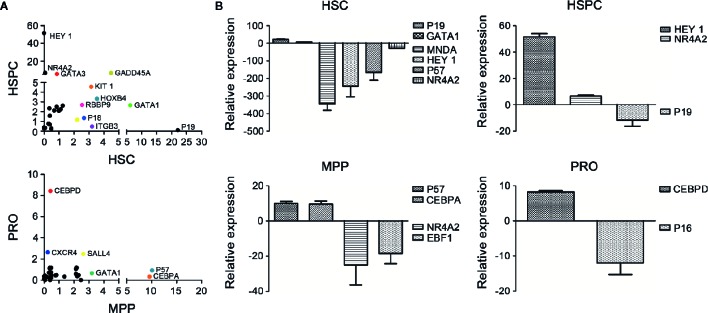
Figure 4.
Differential expression analysis of the genes related to hematopoiesis in cultured hematopoietic cells with or without chrysin treatment. (A) Scatter plot of mRNA profile showing upregulated genes in cultured HSCs (26 genes), HSPCs (26 genes), MPPs (28 genes), and PROs (26 genes) with C2968 treatment. The genes exhibiting significant changes in expression compared with the control group are labeled (p < 0.001). (B) Fold changes of relative mRNA expression of the most significant upregulated or downregulated genes in cultured HSCs, HSPCs, MPPs, or PROs with C2968 treatment. All data were normalized to the expression levels in control (DMSO 0.01%) group. Graphs show means ± SD (n = 100 cells). HSCs, hematopoietic stem cells; HSPCs, hematopoietic stem and progenitor cells; MPPs, multipotential progenitor cells; PROs, progenitor cells.

