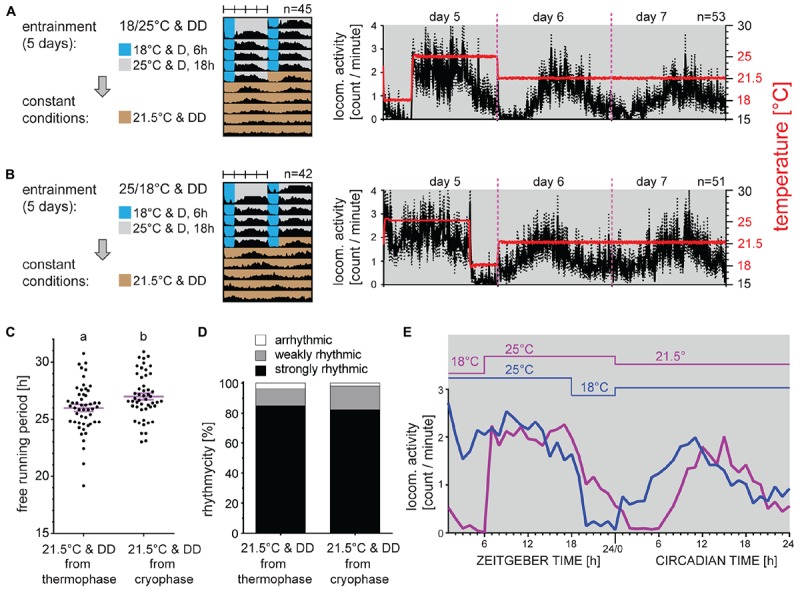
FIGURE 3.

Phase of activity is defined by the thermophase. Adult males developing under long photoperiod (D6:L18) were entrained by 5 days of constant dark and long thermoperiod 18:6 with thermophase at 25°C and cryophase at 18°C. Then, males were released to intermediate temperature (21.5°C) either from the thermophase (A) or from the cryophase (B). Double-plotted actograms represent the average activity of all males rhythmic under constant conditions (see panel (D) for the percent rhythmicity). Detailed activity profile is plotted from all males for day 5–7 [right panels in (A,B)]. The actual temperature recorded during the experiment is shown in red (right y-axis). Detail activity profiles averaged into 1-h bin are shown for the last day of thermoperiodic entrainment and the first day of constant conditions (E). The rhythmicity under constant conditions was determined from 10 days and is presented as the free-running period of each individual male (dots) and mean ± SEM shown in magenta (C), where different small letter above categories indicate statistical difference p < 0.05 (t-test). The percent of arrhythmic, weakly rhythmic and strongly rhythmic males is shown in panel (D).
