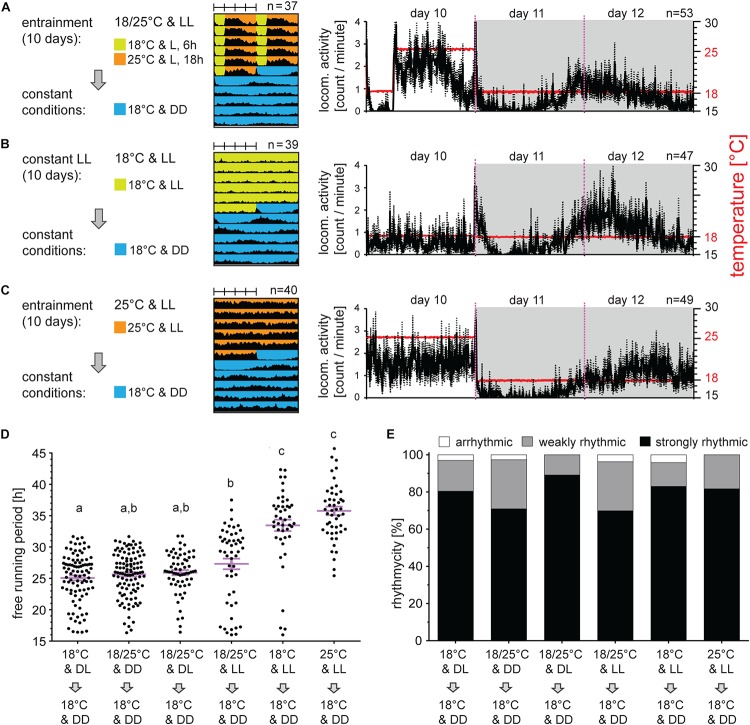
FIGURE 5.
Locomotor activity can be synchronized by temperature cycles in constant light. Adult males developed under long photoperiod (D6:L18) and were exposed either to 10 days of constant light and 18°C or 25°C [panels (B,C), respectively] or to constant light and long thermoperiod (A). Afterward, males were released to constant DD at 18°C. Double-plotted actograms represent the average activity of all males rhythmic under DD conditions [see panel (D) for the rhythmicity]. Detailed activity profile is plotted from all males for day 10–12 [right panels in (A–C)]. The actual temperature recorded during the experiment is shown in red (right y-axis). The rhythmicity under constant conditions was determined from 10 days and is presented as the free-running period of each individual male (dots) and mean ± SEM shown in magenta (D), where different small letter above categories indicate statistical difference p < 0.05 (Kruskal–Wallis test with Dunn’s post hoc test). The percent of arrhythmic, weakly rhythmic and strongly rhythmic males is shown in panel (E).

