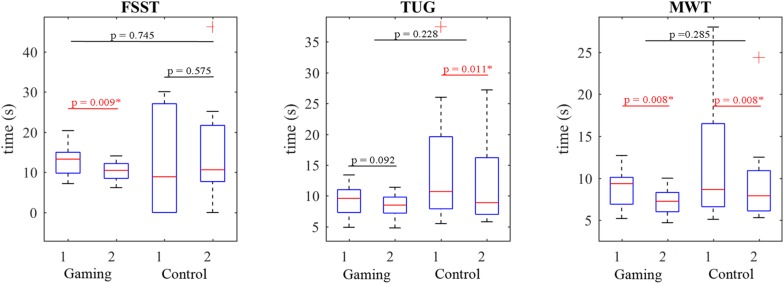
FIGURE 7.
The gaming group (G) demonstrated functional improvements after the training (2-G) in FSST (p = 0.009), TUG (p = 0.092), and MWT (p = 0.008) tests. The control group (C) also improved their TUG and MWT time comparing to the initial results (1-C). Substantive differences were found between the groups in MWT (U3 = 0.7).

