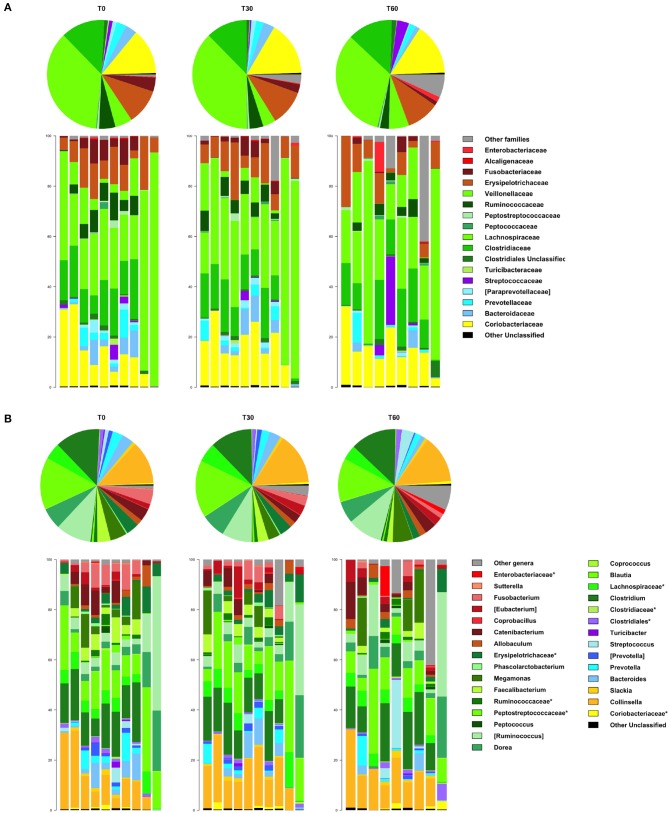
Figure 3.
Impact of Lk administration on the family- and genus-level compositional structure of the gut microbiota of healthy dogs. Relative abundance profiles at family (A) and genus (B) level. Top: pie charts of mean values; bottom: bar plots of individual profiles. T0, baseline; T30, after 30 days of Lk administration; T60, 1 month after the end of the treatment.

