FIGURE 3.
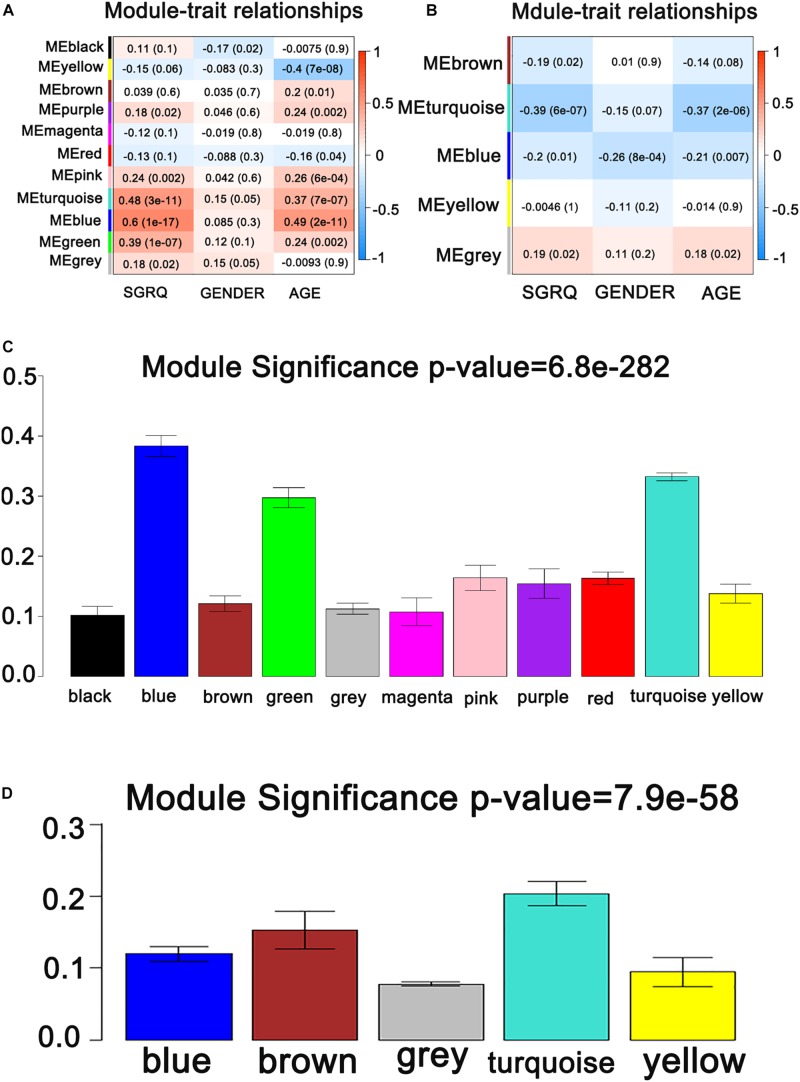
Identification of modules associated with the clinical traits of IPF. (A) Heatmap of the correlation between co-expressed gene module eigengenes and clinical traits of IPF. (B) Heatmap of the correlation between co-expressed miRNA module eigengenes and clinical traits of IPF. (C) Distribution of average gene significance and errors in the modules associated with the scores of SGRQ. (D) Distribution of average miRNA significance and errors in the modules associated with the scores of SGRQ in IPF.

