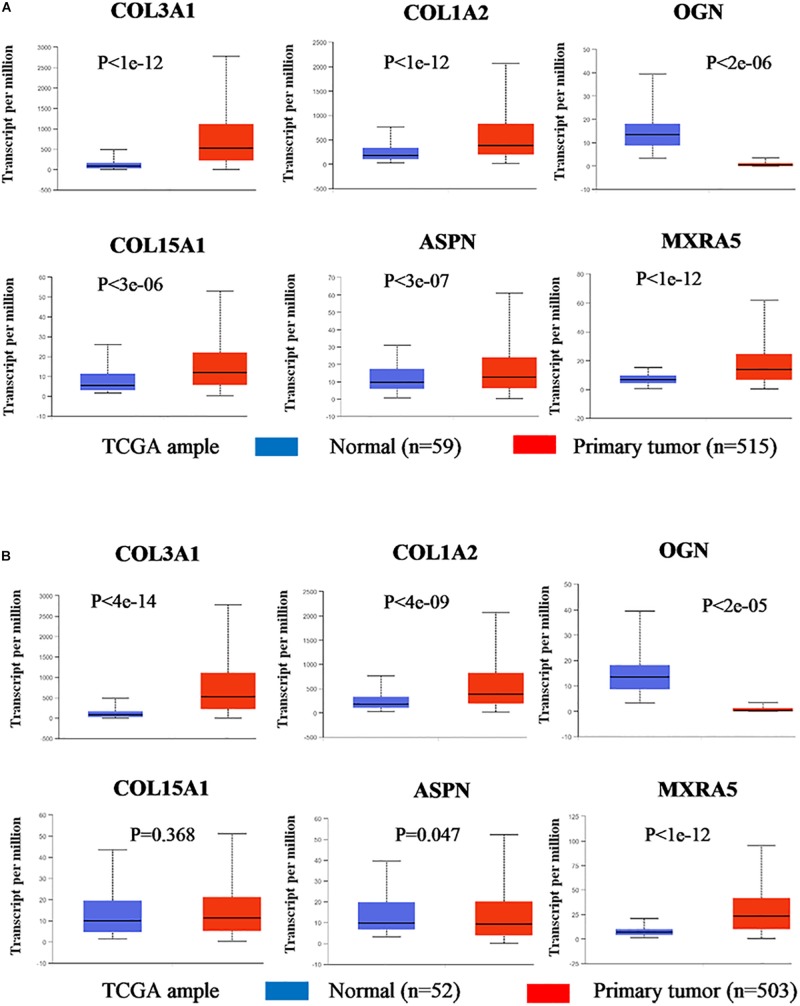
FIGURE 7.
Gene expression levels between normal lung and tumor samples (based on TCGA data in UALCAN). (A) The gene expression levels of COL3A1, COL1A2, OGN, COL15A1, ASPN, and MXRA5 between normal lung tissues and LUAD tissues. (B) The gene expression levels of COL3A1, COL1A2, OGN, COL15A1, ASPN, and MXRA5 between normal lung tissues and LUSC tissues.

