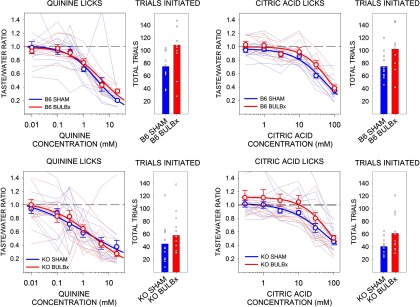
Figure 4.
Mean (±SE) postsurgical taste/water ratios and the mean (±SE) total number of taste trials initiated to quinine and citric acid by B6 (top) and KO (bottom) mice in experiment 2. SHAM groups are shown in blue, and BULBx groups are shown in red. Lighter blue and red lines represent taste/water ratios of individual mice. Only sessions with at least one trial per concentration were included for lick analyses. Group sizes for quinine were as follows: B6 SHAM, n = 12; B6 BULBx, n = 9; KO SHAM, n = 13; KO BULBx, n = 11. Group sizes for citric acid were as follows: B6 SHAM, n = 12; B6 BULBx, n = 8; KO SHAM, n = 13; KO BULBx, n = 12. Licks to each concentration are standardized to the mean (±SE) licks to water. Quinine water licks were as follows: B6 SHAM, 53.8 ± 6.8; B6 BULBx, 49.5 ± 2.1; KO SHAM, 63.22 ± 3.4; KO BULBx, 60.3 ± 4.3. Citric acid water licks were as follows: B6 SHAM, 59.8 ± 2.5; B6 BULBx, 50.7 ± 1.3; KO SHAM, 67.87 ± 2.8; KO BULBx, 57.9 ± 5.5. See Tables 2 and 3 for outcomes of statistical tests.

