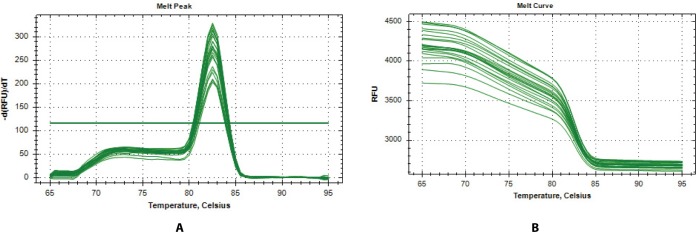
Fig. 2. Melt curve analysis of qPCR products.
(A) Verification of amplification specificity by single-peak melt peak of the qPCR products. (B) Verification of amplification by melt curves of the qPCR products. Melt curve analysis of the amplicons shows a single, sharp melt curve per gene. Cq, quantification cycle; RFU, relative fluorescence units; qPCR, quantitative PCR.

