FIG 5.
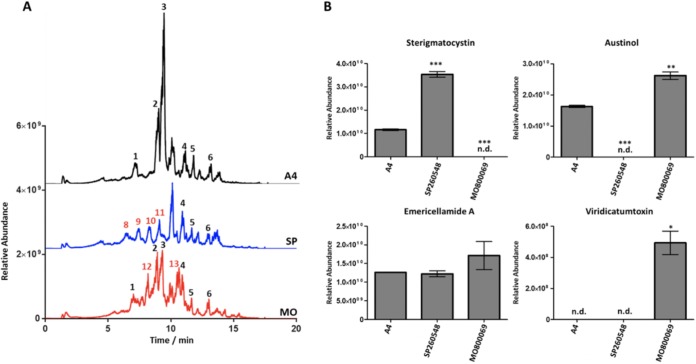
(A) A total ion chromatograms (ES− mode, linked axis) of Aspergillus nidulans isolates A4, SP260548, and MO80069. Known metabolites are annotated as follows: 1, neoaustinone/austinolide; 2, austinol; 3, dehydroaustinol; 4, emericellamide C/D; 5, emericellamide A; 6, emericellamide E/F; 8, C15H26O4 (269.1758); 9, C20H16O8 (383.0769); 10, C20H20O8 (387.1084); 11, C20H18O8 (385.0927); 12, C28H32O12 (559.1819); 13, C27H32O9/C28H28O5N4 (499.1973). Red numbers above peaks indicate that the corresponding metabolite is unique to a single isolate. (B) The relative abundances of four known secondary metabolites produced by A. nidulans isolates were determined from the mean peak area of three biological replicates. Error bars represent ±1 standard deviation. P values were calculated for results from the clinical isolates in comparison to those for the A4 isolate (*, P < 0.05; **, P < 0.01; ***, P < 0.001; n.d., not detected).

