
FIGURE 2.
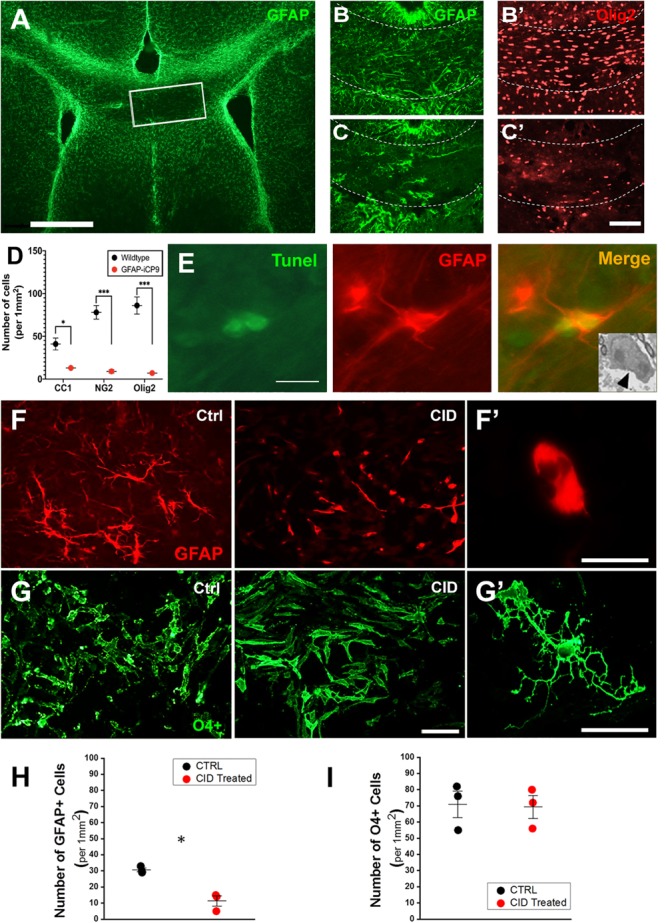
Oligodendrocyte lineage cells are not directly affected by CID treatment but lost following astrocyte ablation in vivo. (A) Local delivery of CID to the corpus callosum (outlined box) of P30 GFAP-iCP9 animals results in highly localized loss of GFAP+ astrocytes (green) after 24 h. (B,C) Representative images from WT (B) or GFAP-iCP9 (C) animals 12 h after local delivery of CID to the corpus callosum labeled for astrocytes (GFAP, green) and oligodendrocyte lineage cells (Olig2, red). The loss of GFAP+ astrocytes was accompanied with local reductions in Olig2+ oligodendrocyte lineage cells. (D) Graph representing numbers of CC1+, NG2+, and Olig2+ cells per unit area in wildtype and GFAP-iCP9 treated mice. (E) 12 h after CID delivery, Tunnel+ (green)/GFAP+ (red) cells were present in (the injected region. The inset represents an EM image showing characteristic apoptotic morphology in a likely astrocyte 12 h after CID delivery (black arrow). (F) In A2B5 enriched cortical cultures from GFAP-iCP9 animals exposed to CID, astrocytes (labeled with GFAP; red) underwent apoptosis as denoted by the presence of fragmented thinner cellular processes. (F’) Higher magnification image of a GFAP+ cell after exposure to CID showing an atrophic astrocyte devoid of cellular processes. (G) Oligodendrocyte lineage cells labeled with a mixture of A2B5, O4, and O1 antibodies (green), were unaffected in number (G) and morphology (G’) by exposure to CID. (H) Graph representing number of GFAP+ cells per unit area showing significant loss after CID delivery. (I) In contrast, no change in the number of oligodendrocyte lineage cells was seen after CID delivery in vitro. Graphs in (D,H,I) represent mean number of cells ± SEM. Two-way ANOVA with Sidak’s multiple comparison tests in (D), and student’s unpaired t-test in (H,I). * indicates p < 0.05, *** indicates p < 0.0001. Scale bars: (A) 500 μm; (B,C) 100 μm; (D) 10 μm; (F,G) 20 μm.)