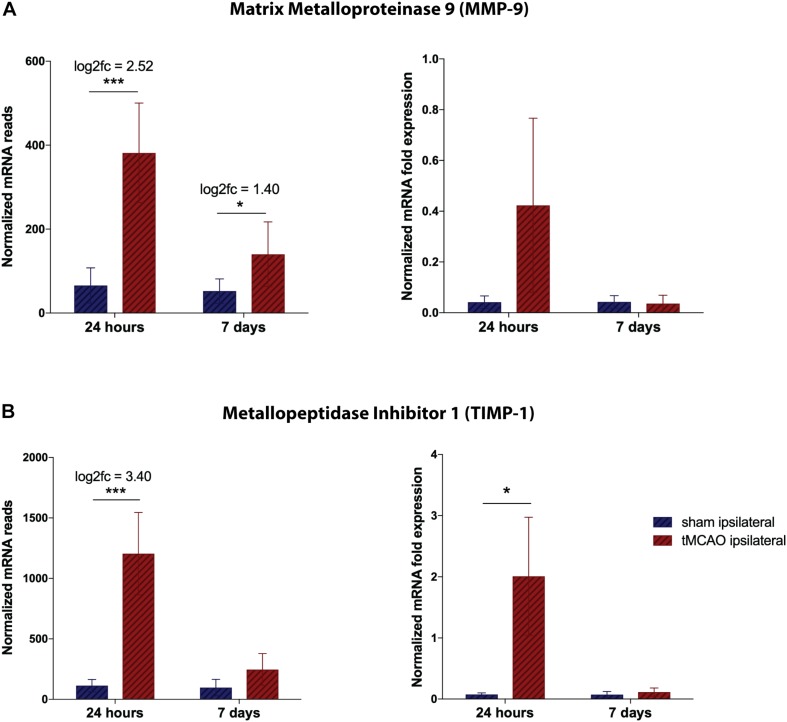
FIGURE 4.
Validation of RNA sequencing dataset by qRT-PCR for proteinases at the NVU. (A) Total mRNA reads for TIMP-1 and MMP-9, normalized by DESEQ2. Presented as mean counts per group ± SD, logarithmic fold change and summarized p-value (n = 3 per group). (B) Quantitative validation by qPCR on remaining RNA and freshly isolated samples, normalized to HPRT. Presented as mean 2–ΔCT values per group ± SD and summarized p-value (n = 3 per group). *p-value < 0.05, ***p-value < 0.0005.

