
Figure 5.
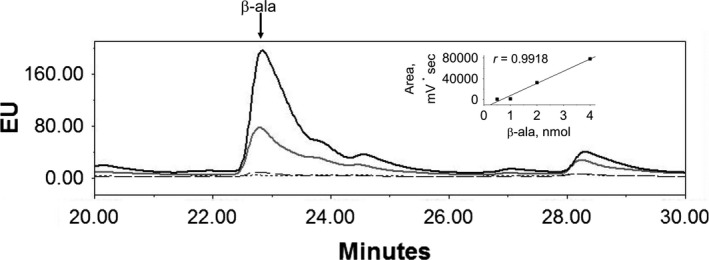
Standard of β‐ala was analyzed by HPLC/fluorescence at 0.5 (dotted line), 1 (dashed line), 2 (gray line), and 4 (black line) nmols following the protocol detailed in Material and Methods. Inset shows the linear analysis of areas from each peak