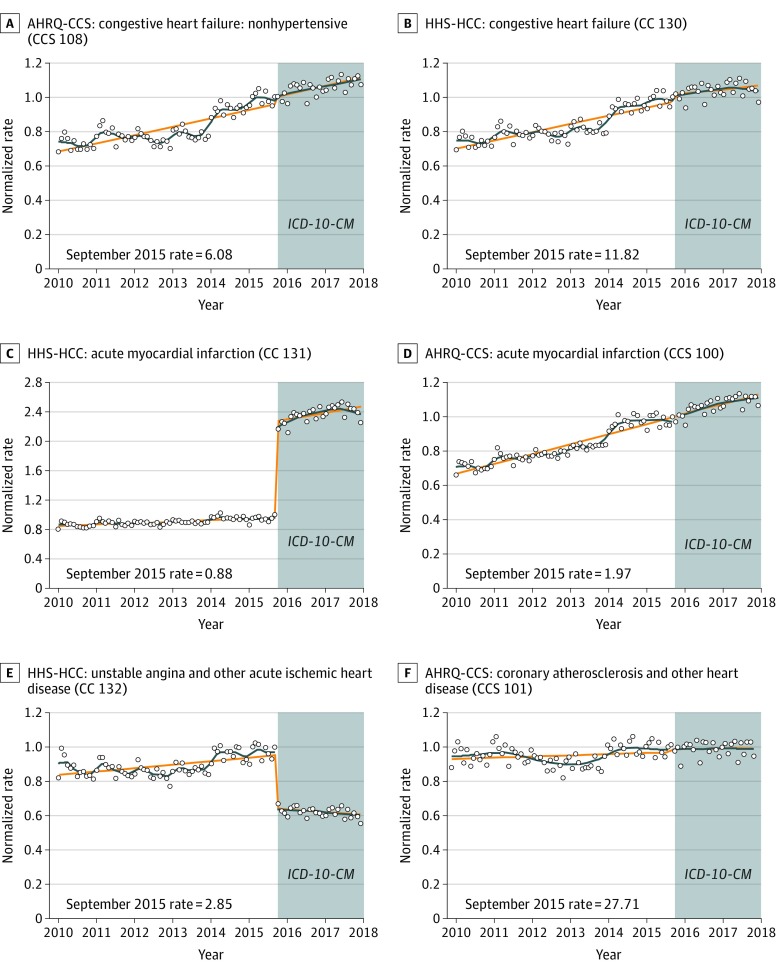
Figure 2. Monthly Diagnostic Category Prevalence Rates of Selected Cardiac Conditions Stratified by Classification System.
The diagnostic category prevalence rate per 10 000 enrollees in September 2015 is presented in the lower left corner of each panel as the reference rate. Curves are fitted with a discontinuity at October 2015. Circles indicate the normalized rate (rate of enrollees with at least 1 diagnosis in a diagnostic category divided by the September 2015 rate); orange lines, predicted rate using a piecewise linear model; blue lines, predicted rate locally estimated scatterplot smoothing algorithm; AHRQ-CCS, Agency for Healthcare Research and Quality Clinical Classification System; HHS-HCC, Health and Human Services Hierarchical Condition Category; and ICD-10-CM, International Statistical Classification of Diseases, Tenth Revision, Clinical Modification.

