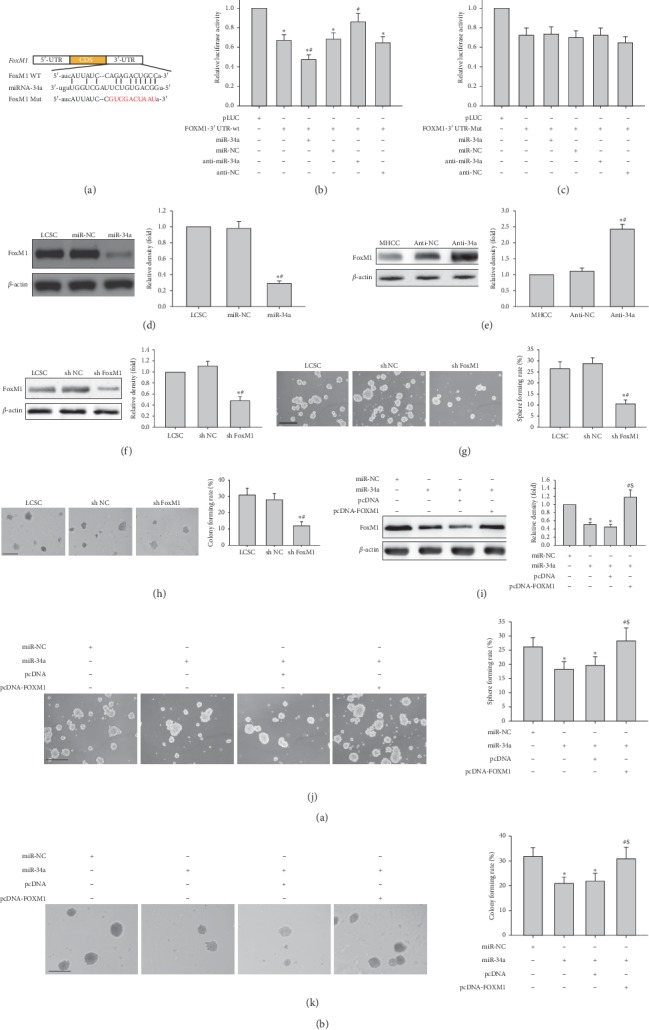
Figure 7.

Sequence-specific downregulation of FOXM1 by miR-34a. (a) Wild type (WT) and mutated (Mut) 3′-UTRs of FOXM1 binding sites with miR-34a. (b, c) Luciferase activities in MHCC97H cells transfected with both firefly luciferase constructs comprising FOXM1-WT or FOXM1-Mut 3′-UTR and miR-34a mimic or the corresponding negative control (NC). (d) FOXM1 protein amounts in LCSCs upon transfection with miR-NC or miR-34a mimic. ∗P < 0.05 vs. LCSC (n = 3); #P < 0.05 vs. LCSCs transfected with miR-NC (n = 3). (e) FOXM1 protein amounts in MHCC97H cells submitted to transfection with anti-NC or miR-34a inhibitor. ∗P < 0.05 vs. MHCC97H cells (n = 3); #P < 0.05 vs. MHCC97H cells transfected with anti-NC (n = 3). (f) FOXM1 protein amounts in LCSCs submitted to transfection with FOXM1 shRNA. (g, h) Representative images of spheres and colonies formed by LCSCs transfected with FOXM1 shRNA (left) (scale bar, 200 μm); sphere formation efficiencies and colony formation rates (right). ∗P < 0.05 vs. LCSC (n = 3); #P < 0.05 vs. LCSCs transfected with sh NC (n = 3). (i) FOXM1 overexpression rescued FOXM1 downregulation at the mRNA and protein levels in LCSCs transfected with miR-34a mimic. (j, k) Representative images of spheres and colonies formed by LCSCs expressing miR-34a transfected with FOXM1 cDNA (left) (scale bar, 200 μm); sphere formation efficiencies and colony formation rates (right). ∗P < 0.05 vs. LCSCs transfected with miR-NC (n = 3); #P < 0.05 vs. LCSCs transduced with pcDNA (n = 3).
