
Figure 1.
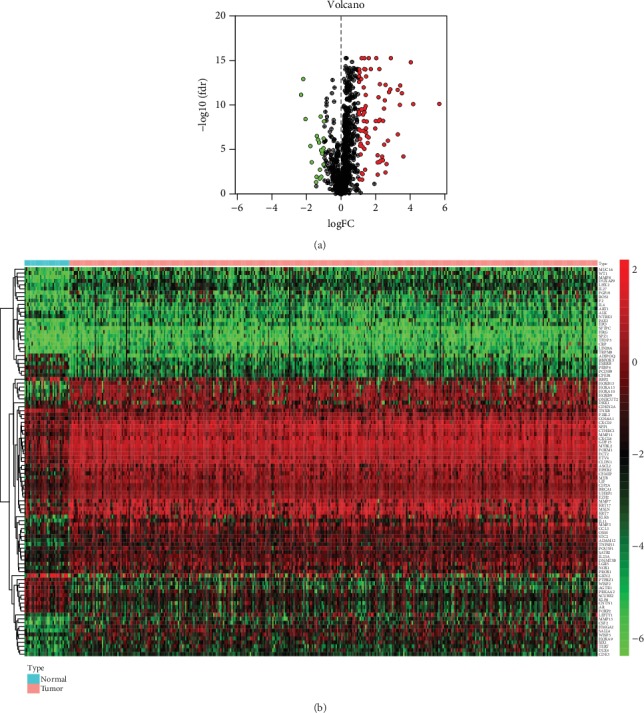
Differentially expressed EMT-related genes (ERGs) between gastric adenocarcinoma (GAC) and normal gastric tissues: (a) the volcano plot for the 1015 ERGs from TCGA-STAD cohort; (b) heatmap for screened ERGs.
Official websites use .gov
A
.gov website belongs to an official
government organization in the United States.
Secure .gov websites use HTTPS
A lock (
) or https:// means you've safely
connected to the .gov website. Share sensitive
information only on official, secure websites.
Differentially expressed EMT-related genes (ERGs) between gastric adenocarcinoma (GAC) and normal gastric tissues: (a) the volcano plot for the 1015 ERGs from TCGA-STAD cohort; (b) heatmap for screened ERGs.