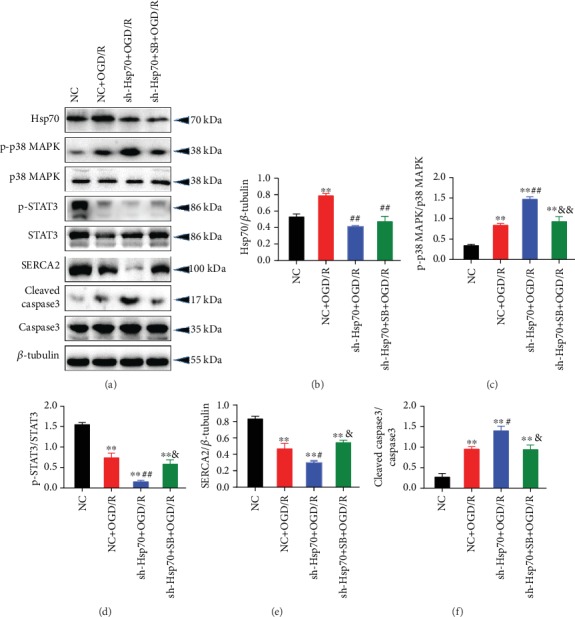
Figure 9.

Changes in protein expression of p-p38 MAPK, p-STAT3, SERCA2, and cleaved caspase3 caused by shRNA-Hsp70 in cells were blocked by p38 MAPK inhibition. (a) Representative western blot bands. (b) Hsp70 protein expression. (c) p-p38 MAPK protein expression. (d) p-STAT3 protein expression. (e) SERCA2 protein expression. (f) Cleaved caspase3 protein expression. n = 5. Data are shown as means ± SEM. ∗∗P < 0.01 vs. the NC group; #P < 0.05, ##P < 0.01 vs. the NC + OGD/R group; &P < 0.05, &&P < 0.01 vs. the sh − Hsp70 + OGD/R group. NC: negative control transfection; OGD/R: oxygen-glucose deprivation/reoxygenation.
