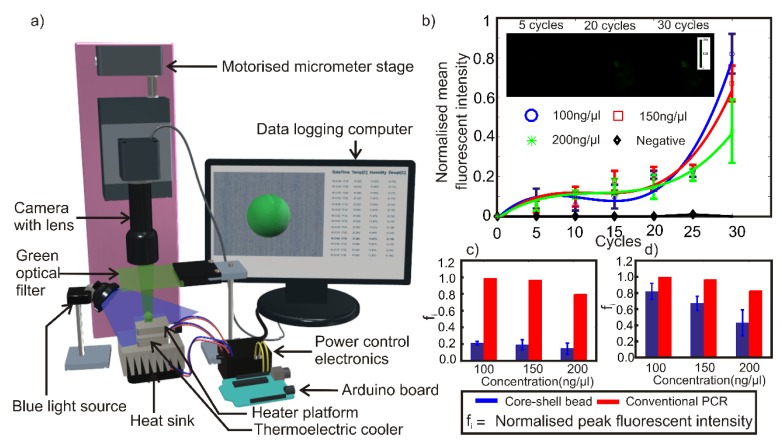
Figure 4.
(a) Schematic of the experimental setup. (b) Variation of normalized mean fluorescent intensity of the PCR mixture in the core-shell bead with respect to thermal cycles. Sample micrographs of the core-shell bead are given as inset. Comparison of normalized peak fluorescent intensity of core-shell bead PCR with conventional quantitative reverse transcription PCR (qRT-PCR) after (c) 20 cycles. (d) 30 cycles.

