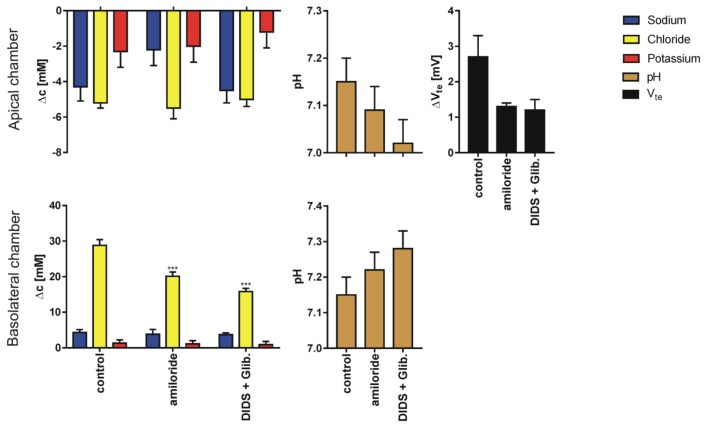
Figure 6.
The results (Mean ± SD) of experiments performed in reversed chloride gradient (apical side, KHS1; basolateral side, KHS3) in control conditions and after supplementation of the solution with ion channel blockers. The graph represents: sodium, chloride, potassium transport across epithelial cell monolayer expressed as the concentration change measured 10 min after appropriate solution flow stop; final pH value and the transepithelial potential difference change (N = 10–13 for Cl−, Na+ and Vte, N = 5 for K+ and pH, dependent sample t-test, * p <0.05, ** p <0.01, *** p <0.001). Note different scales for apical and basolateral graphs.

