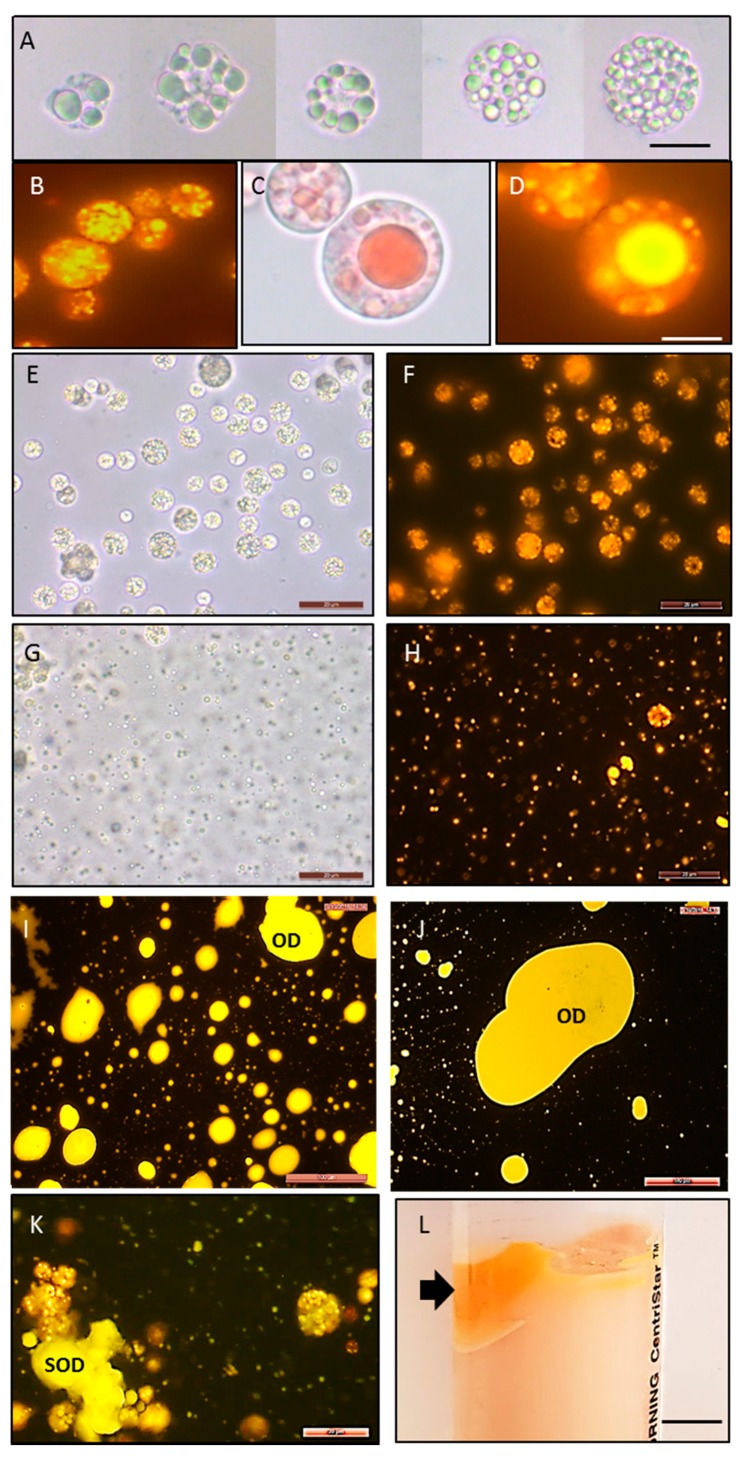
Figure 6.
Recovery of oil bodies. (A–D): Oil bodies’ accumulation in cells; (E,F): cells before pH 12 treatment; (G–H): oil bodies 15 min after pH 12 treatment; (I–K: oil droplets and solidified oil droplets in the supernatant after 3–12 h of pH 12 treatment. (L): Accumulation of OBs (shown by arrow) after centrifugation; (A,C,E,G): bright-field microscopy; (B,D,F,H–K): fluorescent microscopy after staining lipids with Nile Red. OD: oil droplets; SOD: solidified oil droplets. Scale bars: (A–H, K) = 20 µm; (I,J) = 100 µm; (L) = 1 cm.

