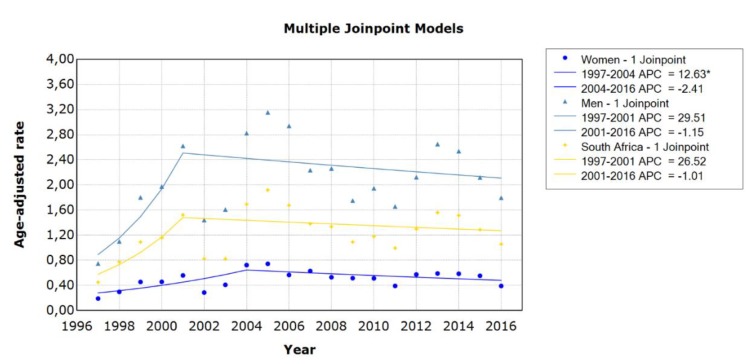
Figure 2.
Trends in age-standardised suicide mortality rates in men and women in South Africa using joinpoint regression analysis. Data markers represent observed rates; lines represent joinpoint regression using one joinpoint; APC = annual percentage change; * indicates that the APC is significantly different from zero at the alpha = 0.05 level.

