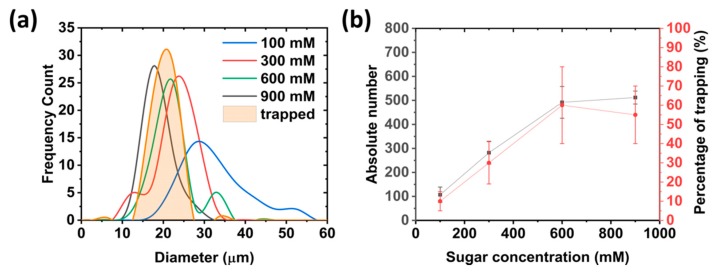
Figure 2.
Optimization of the inverted emulsion method within the microfluidic device. (a) Distribution of GUV sizes produced in the chip with various sugar concentrations. Mean diameters were 31 ± 8, 25 ± 4, 21 ± 4, and 15 ± 3 µm for 100, 300, 600, and 900 mM respectively. For comparison, the size of the GUVs captured inside the microfluidic chip was 18 ± 4 µm in diameter. (b) Dependency of the yield of vesicles and the occupancy of the traps with respect to the sugar concentration. The percentage trapping occupancy was calculated by dividing the number of traps containing a GUV with that of total number of traps (108) multiplied by 100. Mean values are given with error bars taken from standard deviations (n = 3). Note that, for both cases, vesicles where counted manually.

