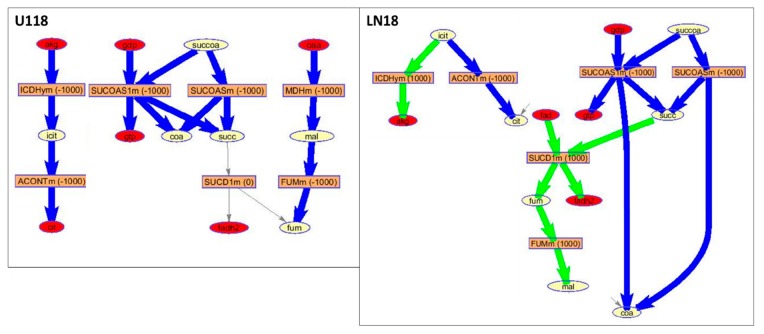
Figure 8.
Part of the TCA-cycle-related metabolic processes. GIMME calculated fluxes in LN18 and U118 EVs made possible based on previously determined proteins in these vesicles. GIMME analysis provides a flux model with a minimized use of low-expression reactions while maximizing the objective reaction, in this case biomass preservation. Reactions are shown using the modeldraw.rxns routine in COBRA running under Matlab. Excluded from the representation are the cofactors including CO2, H2O, ATP, ADP, NAD, NADH, NADPH, NADP, H, Pi. In the figure, rectangles represent reactions with rates of fluxes in parentheses; ellipses represent metabolites; the red ellipses represent dead-end metabolites; gray arrows represent zero-rate fluxes; green arrows represent positive-rate (forward) fluxes; and blue arrows represent negative-rate (backward) fluxes. Reactions and metabolites notation is based on the Recon 3 metabolic network and is: akg—oxoglutarate (a-ketoglutarate), icit—isocitrate, cit—citrate, succ—succinate, mal—malate, fum—fumarate, coa—coenzyme A; gtp—guanosine triphosphate; fadh2—Flavin adenine dinucleotide.

