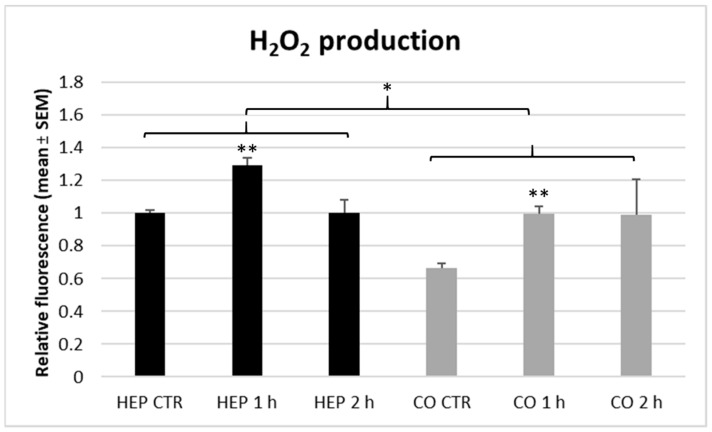
Figure 7.
The hydrogen peroxide (H2O2) production of hepatocyte mono-cultures (“HEP”) and hepatocyte—nonparenchymal cell co-cultures (“CO”) as indicated by the Amplex Red assay. The “CTR” refers to control cells with no heat exposure, while “1 h” and “2 h” indicate incubation of cell cultures at 43 °C for 1 or 2 h, respectively. Relative fluorescences were calculated by considering the mean value of control hepatocyte mono-cultures as 1. Results are expressed as mean ± standard error of the mean (SEM), n = 3/group. Asterisks over bars of “1 h” and “2 h” refer to significant differences compared to “CTR” cells within the same cell culture model. Significant differences between cell culture models are indicated with asterisks on the clamps. * p < 0.05, ** p < 0.01.

