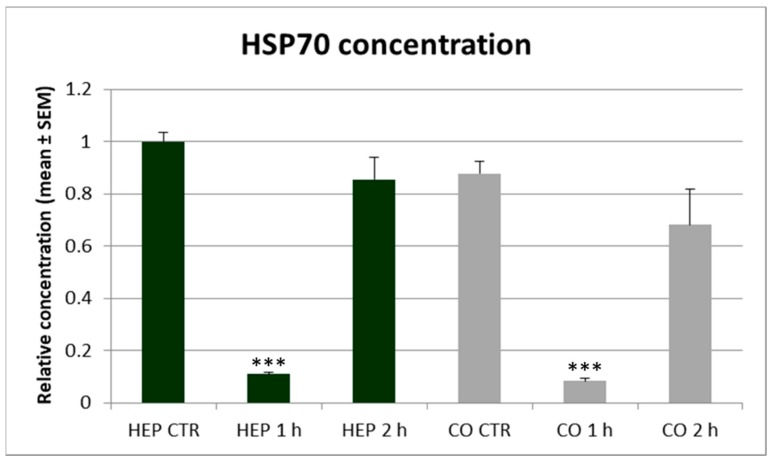
Figure 8.
The heat shock protein 70 (HSP70) concentration in culture media of hepatocyte mono-cultures (“HEP”) and hepatocyte—nonparenchymal cell co-cultures (“CO”) as measured by a chicken specific ELISA assay. The “CTR” refers to control cells with no heat exposure, while “1 h” and “2 h” indicate incubation of cell cultures at 43 °C for 1 or 2 h, respectively. Relative concentrations were calculated by considering the mean value of control hepatocyte mono-cultures as 1. Results are expressed as mean ± standard error of the mean (SEM), n = 3/group. Asterisks over bars of “1 h” and “2 h” refer to significant differences compared to “CTR” cells within the same cell culture model. *** p < 0.001.

