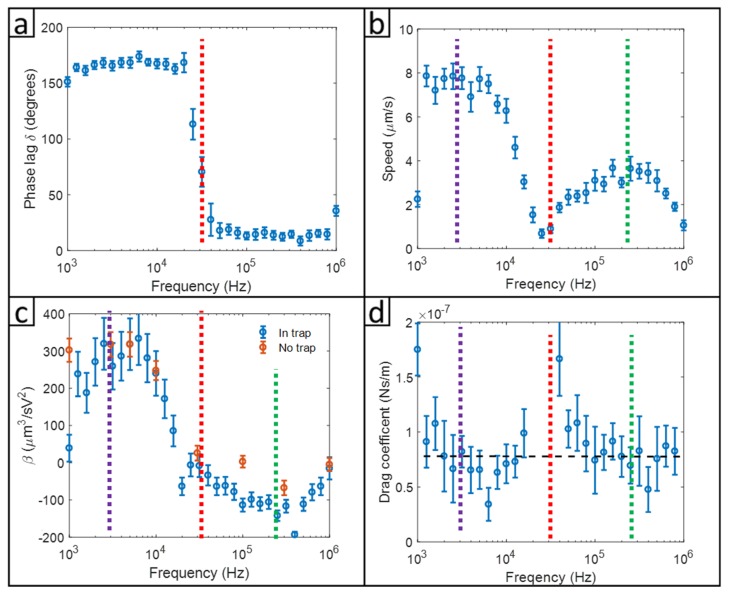
Figure 6.
Experimental results of PFS at 0.1 V/m of the carrier frequency of the electric field from 1 kHz to 1 MHz with 1 Hz amplitude modulation frequency at 30% modulation amplitude. The vertical dash rad lines represent the crossover frequency at 27 kHz. The vertical dash green line represents the maximum reversal velocity at 220 kHz. The vertical dash purple line represents the maximum forward velocity at 1–5 kHz. (a) Phase delays of a 3 m Janus particle. (b) Speeds of the same 3 m Janus particle. (c) Comparison of the Beta values of the Janus particles measured with trapping (Equation (3)) and without trapping. (d) Drag coefficients determined from the phase delay data.

