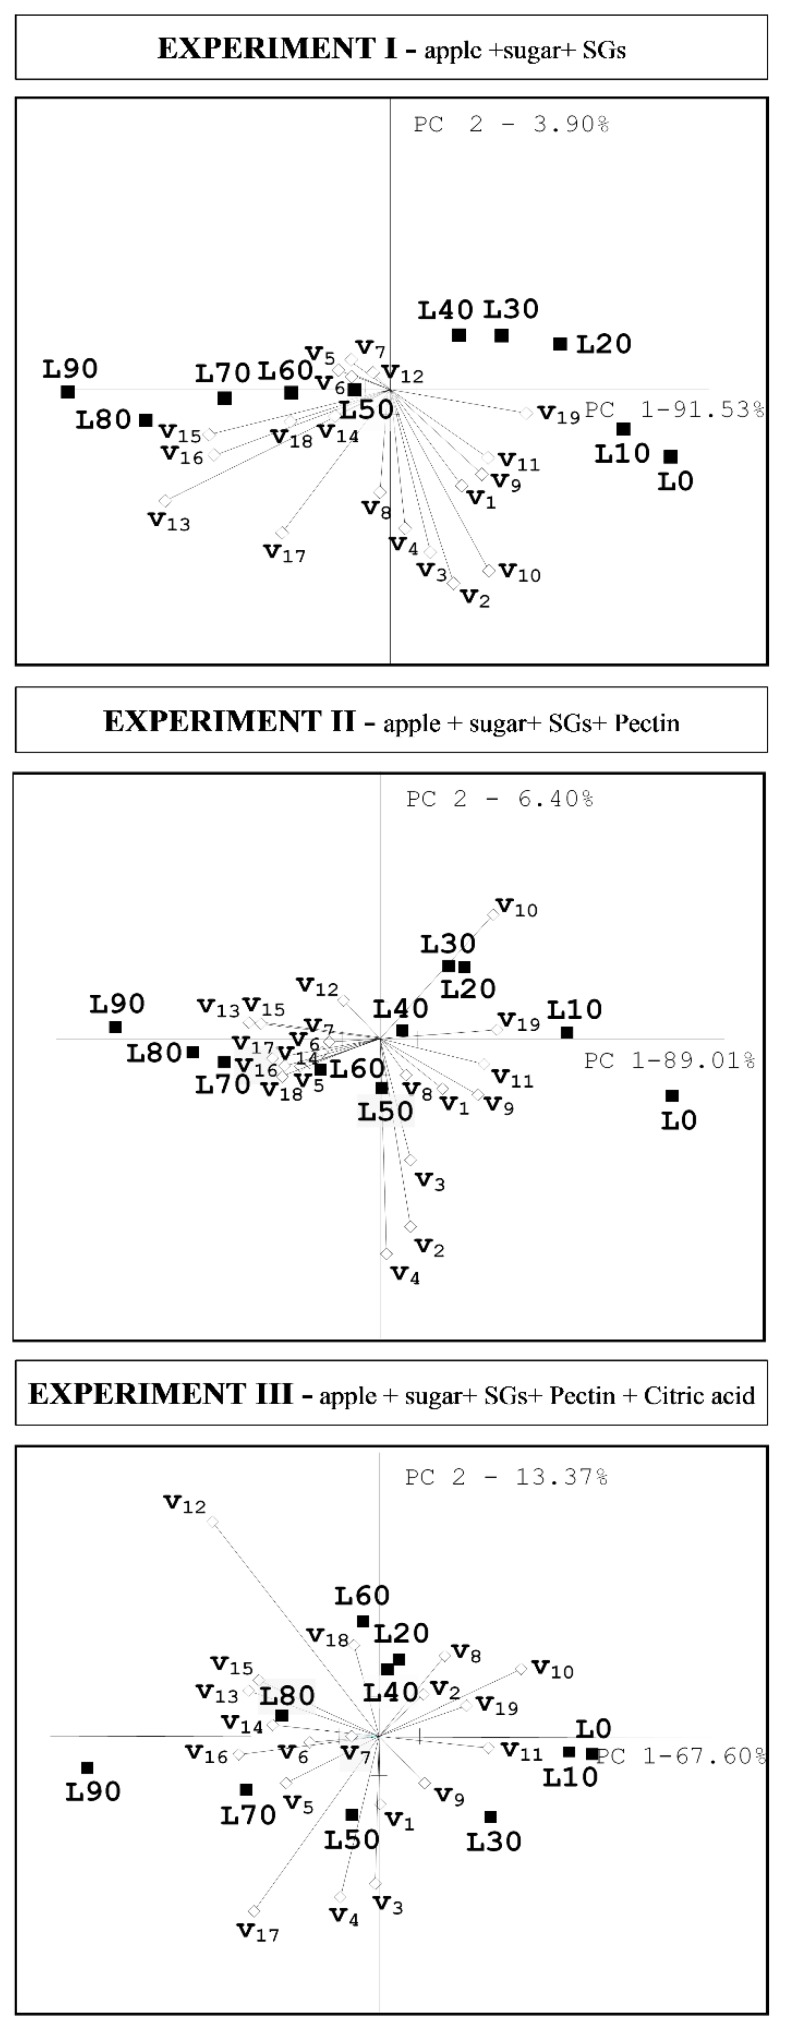
Figure 2.
Principal components analysis (PCA) biplot of apple preserves’ sensory profiles. L0–L90— samples with 0%–90% SGs substitution; v1—apple o., v2—sweet o., v3—nectar o., v4—wine o., v5— metallic o., v6—sharp o., v7—other o., v8—color, v9—apple f., v10—sweet t., v11—nectar f., v12—sour t., v13—bitter t., v14—spicy f., v15—metallic f., v16—astringent s., v17—bland f., v18—other f., v19—sensory balance; o—odor, f—flavor, t—taste, s—sensation.

