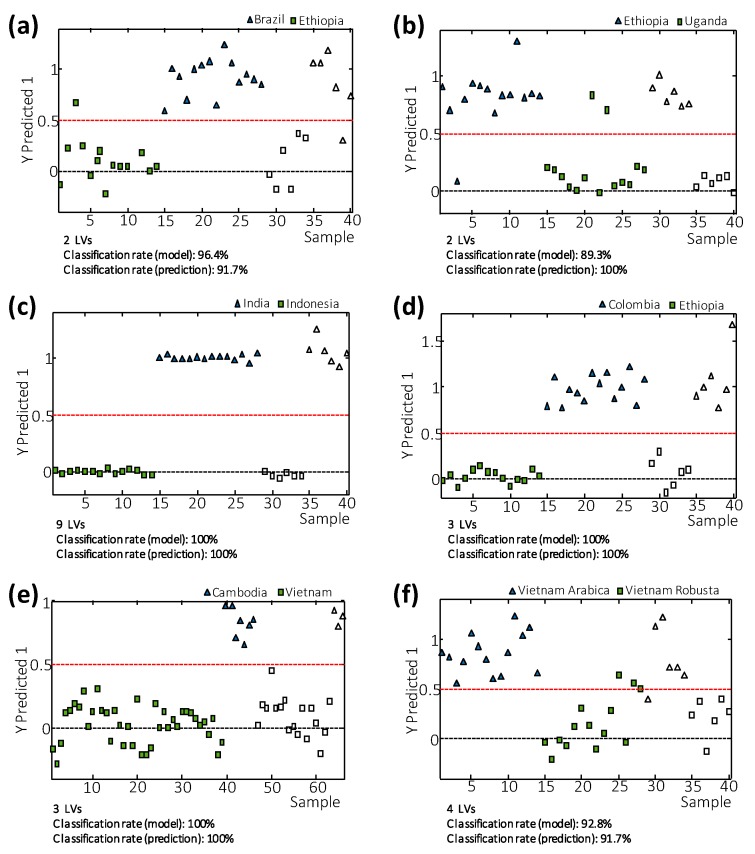
Figure 5.
Sample vs. Y predicted 1 values plot for (a) Brazilian vs. Ethiopian coffees, (b) Ethiopian vs. Uganda coffees, (c) Indonesian vs. Indian coffees, (d) Colombian vs. Ethiopian coffees, (e) Vietnamese vs. Cambodian coffees, and (f) Vietnamese Arabica vs. Vietnamese Robusta coffees. Filled and empty symbols correspond to calibration and validation sets, respectively. Dashed red lines represented the threshold separating one class from the other. The number of latent variables (LVs) employed to generate each classificatory model and sample classification rate are also indicated.

