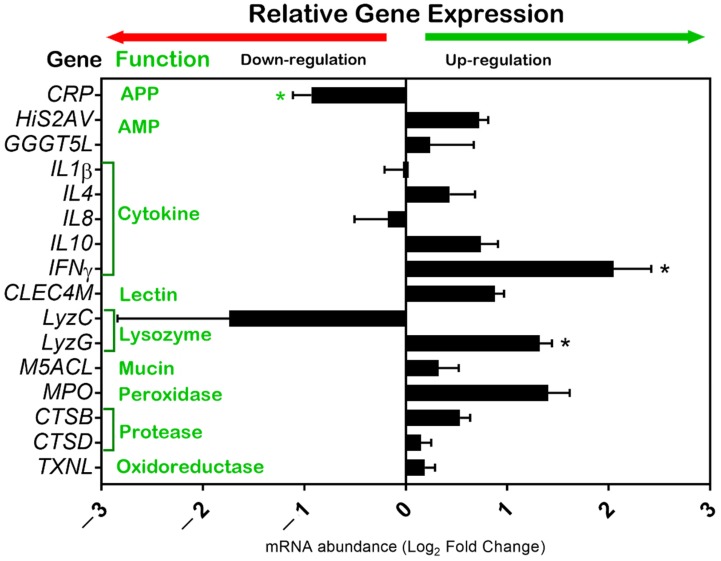
Figure 2.
Immune-related gene expression signatures identified in the skin mucosa of common carp (Cyprinus carpio) supplemented with GOS. The Y-axis shows a list of genes (black) and enzymatic function of encoded proteins (green). Horizontal bars on the X-axis indicate the relative mRNA abundance of the genes of GOS-supplemented animals (n = 8). Gene expression analysis was carried out with RT-qPCR. qPCR reactions were performed in triplicates. The geometric mean of the 40s s11 and ACTB reference genes was used to calculate dCt values. The relative gene expression was calculated with the ddCt formula (FC = 2–ΔΔCt). FC values were transformed and presented as Log2FC. The standard error of the means (SEM) shows the distribution of the Ct values. Normalized data (dCt values) of control and treated groups were compared with the Student’s t-test. Significant differences (p < 0.05) were labeled with an asterisk (*). Figures were prepared using GraphPad Prism 7 (GraphPad, La Jolla, CA, USA). Abbreviations used in the figure: APP—acute-phase proteins; AMP—antimicrobial proteins.

