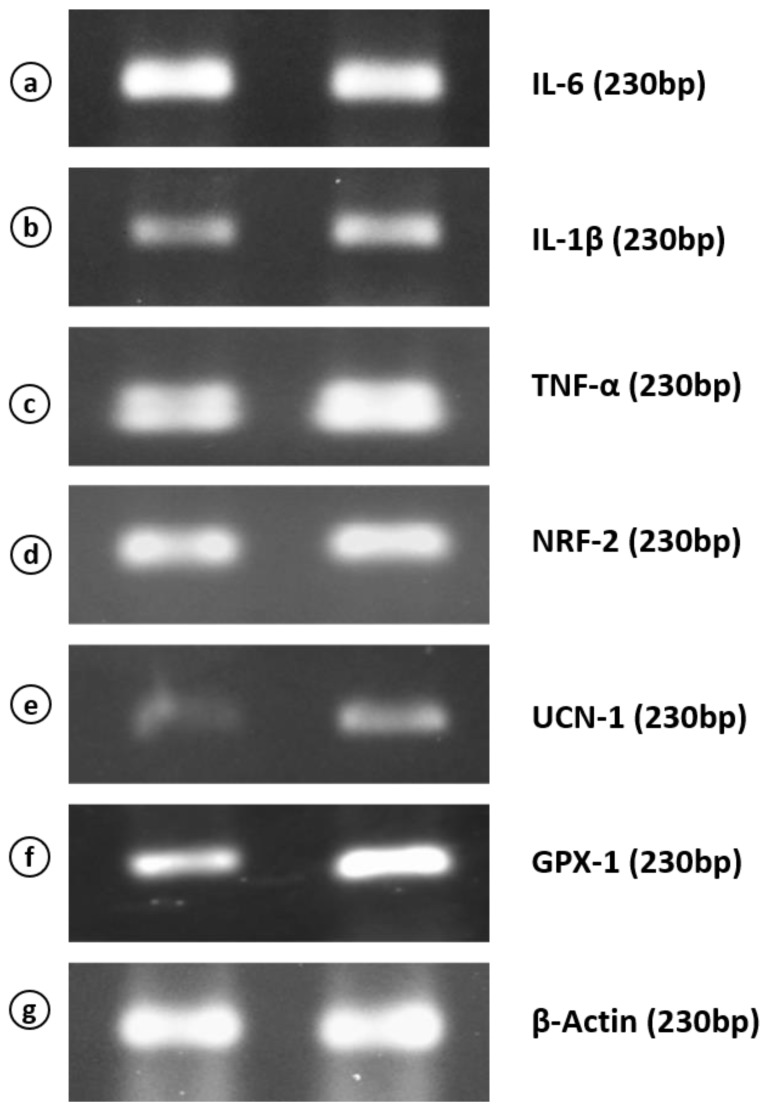
Figure 5.
Semi-quantitative PCR analysis of mRNA expression levels of interleukin-6 (IL-6) (a), interleukin-1β (IL1–β) (b), tumor necrosis factor-α (TNF-α) (c), nuclear factor erythroid 2-related factor-2 (Nrf2) (d), urocortin-1 (Ucn1) (e), glutathione peroxidase-1 (Gpx-1) (f) and β-actin (g) in the liver of control and hyperandrogenic PCOM rats.

