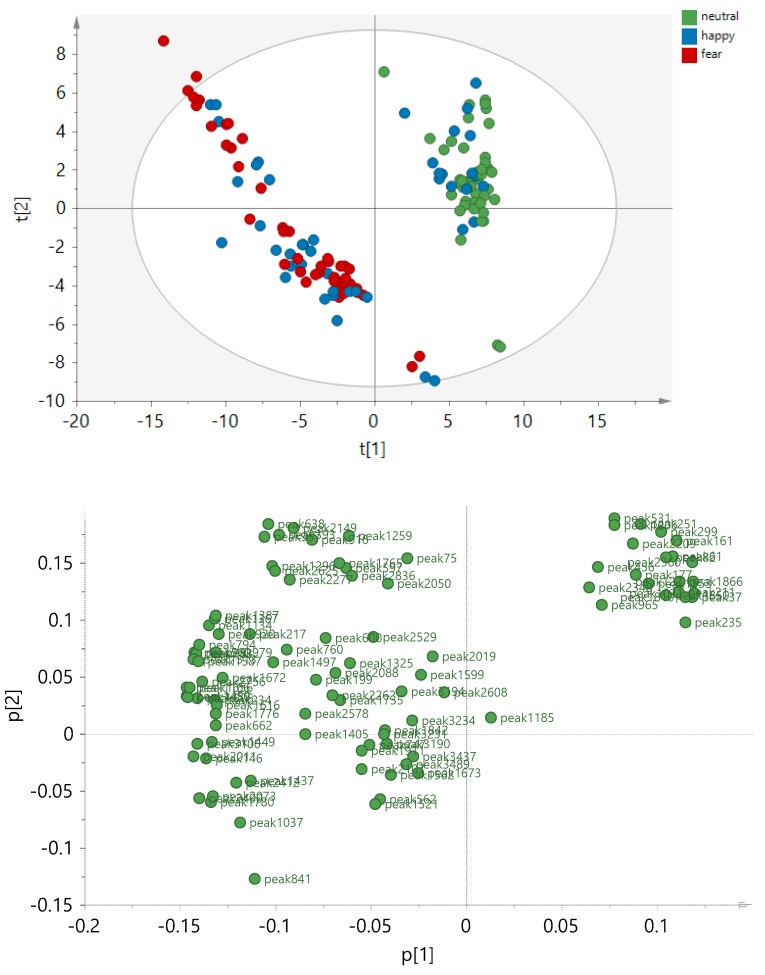
Figure 3.
Principal component analysis (PCA) score plot based on 135 sweat samples and 94 peak areas that were significantly discriminating the condition groups in the PLS-DA models. The principal components t[1], t[2] are displayed, explaining R2X[1]= 0.437 and R2X[2] = 0.141 of the variances, respectively. The data were not normalized and Pareto scaling was applied.

