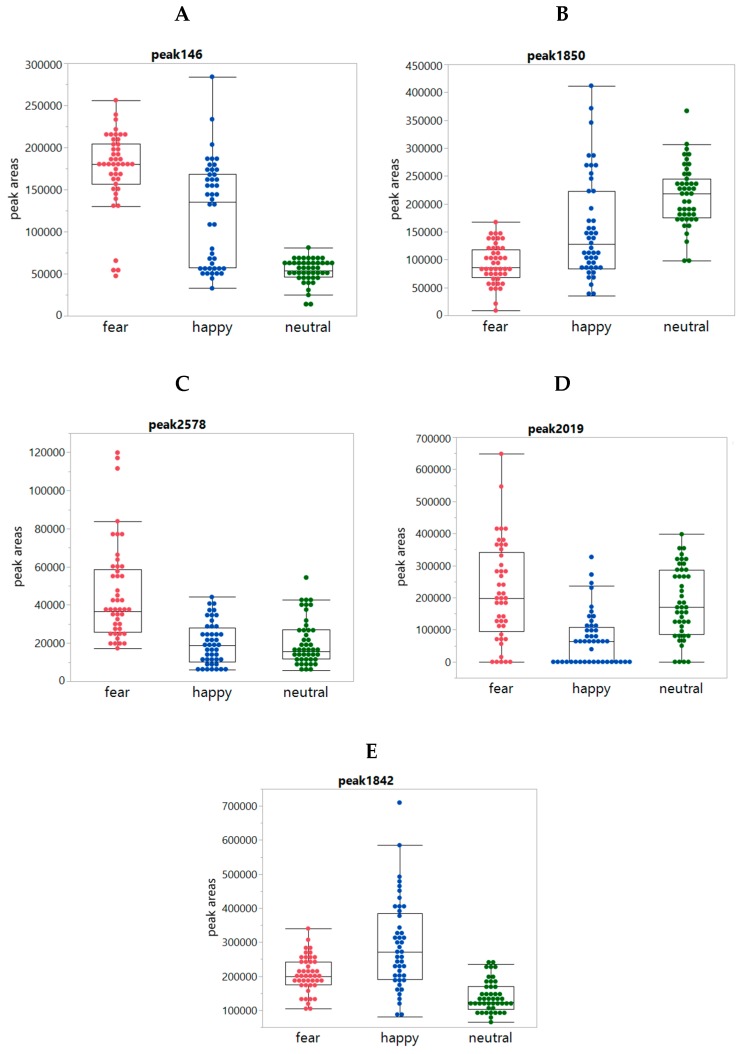
Figure 4.
Box plots showing individual peaks per condition class: Panels (A–E) show the boxplots of the peaks 146, 1850, 2578, 2019, and 1842, respectively, per condition for each of the 24 panelists as observed in underarm sweat both left and right (so 48 datapoints for each of the three conditions in each graph).

