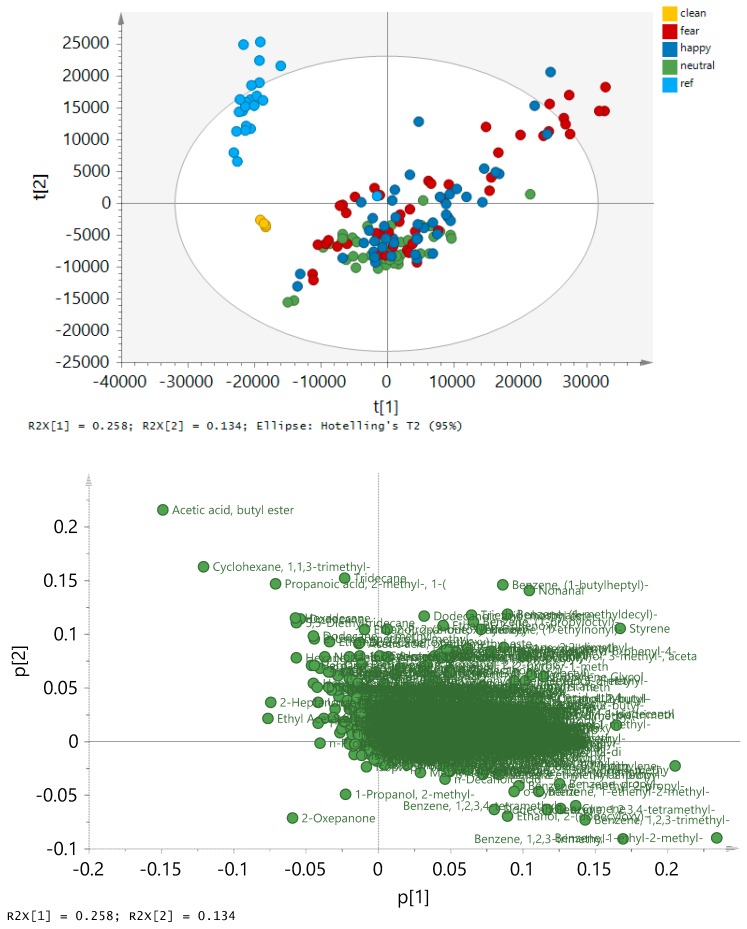
Figure A4.
PCA performed on 3796 RT/MS peaks and 169 pads using Pareto scaling. The scores plot (upper panel) displays the variation of the pads classified as clean (from clean pads), reference (from pads deposited in the room), and the condition samples (Neutral, Happy, Fear from the subjects). The loading plot (lower panel) displays the variation of the analytes with tentative assignments.

