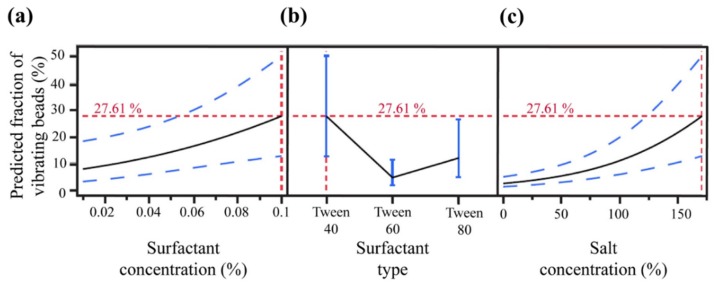
Figure 3.
Prediction profiler for evaluating the optimal working buffer composition modeled on: (a) surfactant concentration; (b) surfactant type; and (c) salt concentration. The dotted blue and red lines indicate the confidence interval and maximum predicted fraction of vibrating MBs, respectively.

