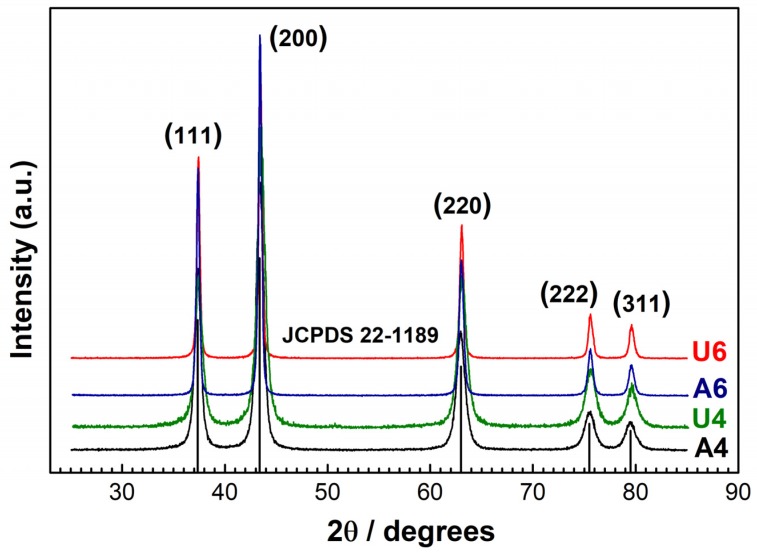
Figure 1.
XRD diffraction patterns of NiO samples. The black solid line (—) represents sample A4, the green solid line (—) represents sample U4, the blue solid line (—) represents sample A6, and the red solid line (—) represents sample U6. The black vertical lines are the reflexes of NiO as from the reference data JCPDS 22-1189.

