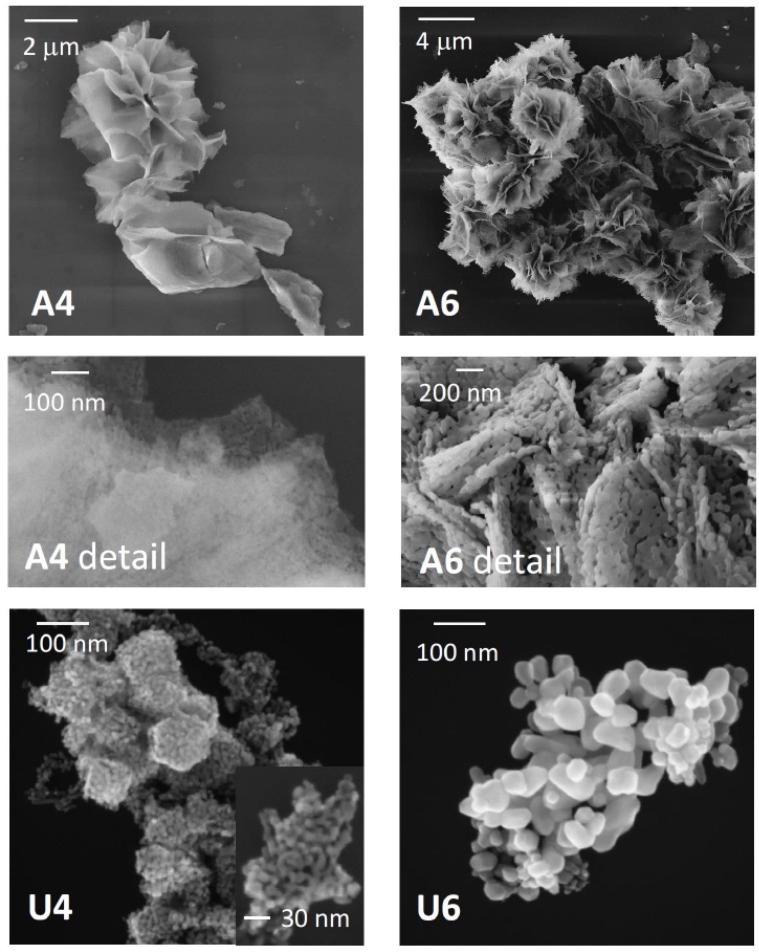
Figure 2.
SEM images of different NiO samples. The samples are indicated by the labels in the figures. The central panels are the details of samples A4 and A6 at higher magnifications, where the texture can be better appreciated. The inset in the panel of sample U4 shows higher-magnification details, which evidences the nanoparticles size and aggregation.

