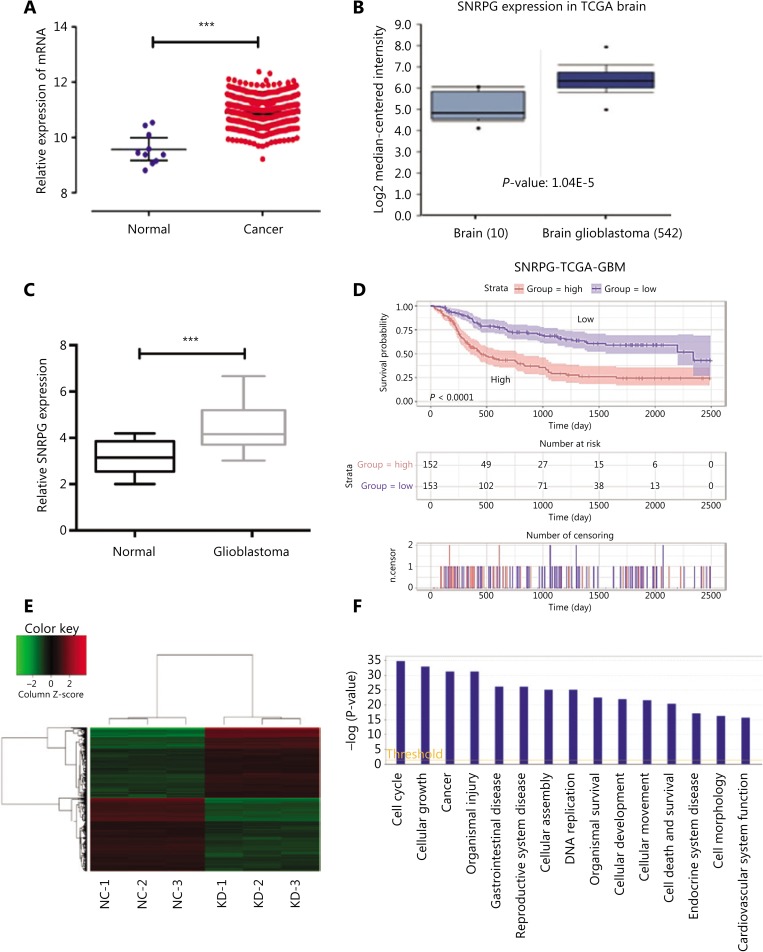
Figure 1.
The involvement of SNRPG in human glioblastoma multiforme (GBM). (A) The correlation of SNRPG RNA expression levels with the incidence of GBM was examined via the t-test using the R programming language. The selection criteria were a P < 0.05 and |logFC| ≥ 1 (with 2 as the base). FC = 2.46, P = 3.86E-16. (B) Using Oncomine (https://www.oncomine.org/resource/login.html), the SNRPG expression in GBM tissues (n = 542) was compared with that in normal tissues (n = 10) in the “TCGA brain” of the TCGA dataset, revealing that SNRPG was significantly upregulated in GBM tissue compared with that in normal tissue. (C) SNRPG expression was examined in 15 GBM tissues and nontumor tissues by RT-qPCR, revealing significantly increased expression in GBM tissues compared with that in the normal tissue samples. Error bars, standard error. ***P < 0.001. (D) Kaplan-Meier survival analyses of GBM with different levels of SNRPG using the TCGA dataset and the R programming language. (E-F) Gene expression profile analysis revealed the downstream targets affected by SNRPG. (E) The heat map shows the differentially expressed genes in all samples. (F) The histogram of disease and function shows the enrichment of differential genes in disease and their functional classifications.

